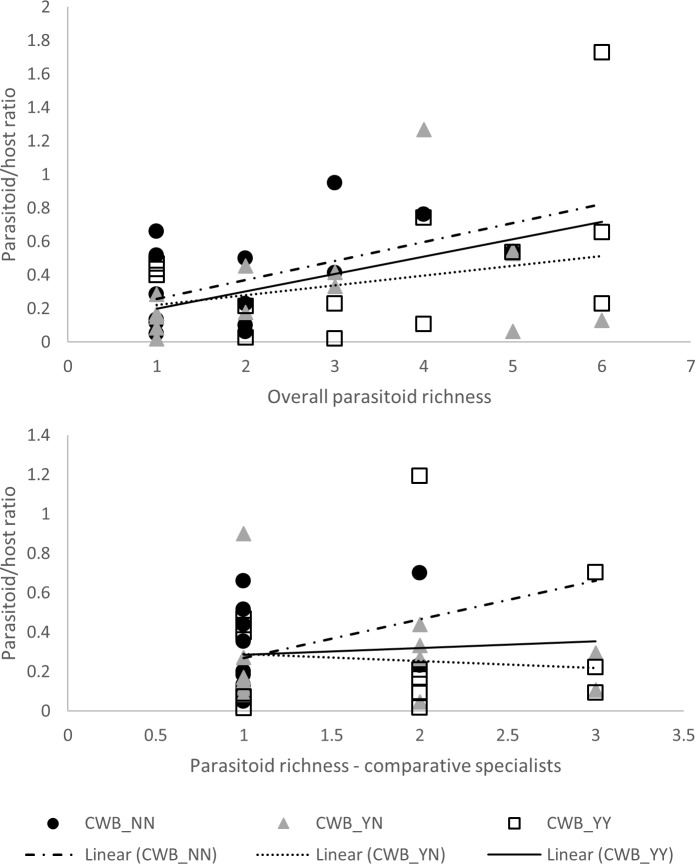
Fig 5. Diversity-function relationship, as represented by species richness of total parasitoids or comparative specialists versus parasitoid / host ratio (arcsin square root transformed).
Regression curves are presented for different conditions of field- and plant-level disease incidence: CWB_NN (uninfected plants, in CWB-free plots), CWB_YN (uninfected plants, in CWB-affected plots), CWB_YY (infected plants, in CWB-affected plots). No significant interaction effects were observed for CWB infection status.

