Fig. 2.
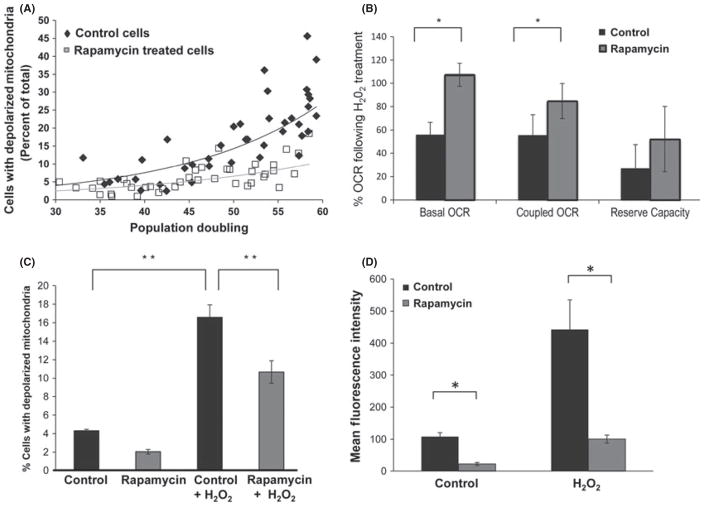
Improved mitochondrial profile upon inhibition of mammalian target of rapamycin (mTOR) with rapamycin. (A) Mitochondrial membrane potential was assessed by JC-1 staining and flow cytometry at the indicated time points during replicative life span of cells grown with or without 1 nM rapamycin (Life span curve presented in Fig. 3). The percentage of cells with depolarized mitochondria was calculated at each population doubling as described in Methods and in the legend for Fig. S3 (Supporting information). Vehicle-treated cells show a significant increase in the number of cells with reduced mitochondrial membrane potential with increasing population doubling (Spearman’s ρ = 0.855, P < 0.01), while the correlation between population doublings and percent of cells with depolarized mitochondria was not significant in cells maintained in the presence of 1 nM rapamycin (P = 0.533). WI-38 fibroblast cells were maintained in complete growth media for life span analysis as described in Methods. Cells were maintained in either normal growth media or in media containing rapamycin (1 nM). Rapamycin was present in culture media at all times during propagation. (B) Relative oxygen-coupled respiration (OCR) of cells growing in control and 1 nM rapamycin-supplemented medium upon exposure to H2O2 (200 μM for 30 min). Basal, ATP-coupled, and reserve OCR were measured using a Seahorse XF Analyzer. An average of three independent measurements is presented. C) Mitochondrial membrane potential of vehicle and rapamycin-treated cells 24 hours after exposure to H2O2 (100μM for 60 minutes) as measured by JC-1 staining. Mitochondrial membrane potential was determined as described in Methods and in the legend for Figure S3. The percentage of cells with depolarized mitochondria within the population are presented. Bars are average +/− standard deviation of 3 independent samples. (D) Accumulation of ROS as measured by DCFDA staining and fluorescence spectroscopy. Bars are average +/− standard deviation of 3 independent samples normalized for protein content. In all cases, measurements that differ significantly (P < 0.05) are marked with an asterisk. Differences marked with two asterisks are significant at the P < 0.01 level.

