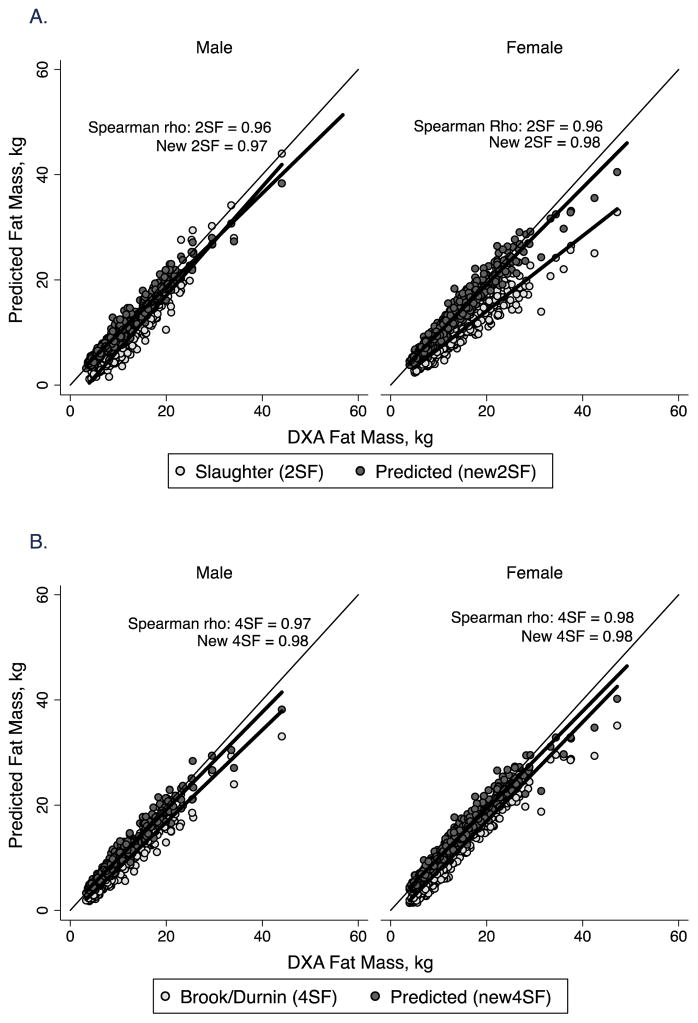
Figure 2.
Correlation plot of fat mass by body composition prediction equations vs. DXA in males and females in the healthy reference sample. The line of identity is included. A. 2-skinfold equations of Slaughter et al (1988) (2SF) and new prediction equations (New 2SF). The Spearman correlation coefficient (rho) for both is shown; B. 4-skinfold equations from published sources (Brook, 1971, Durnin and Rahaman, 1967, Durnin and Womersley, 1974) (4SF) and new prediction equations (New 4SF). The Spearman correlation coefficient (rho) for both is shown.

