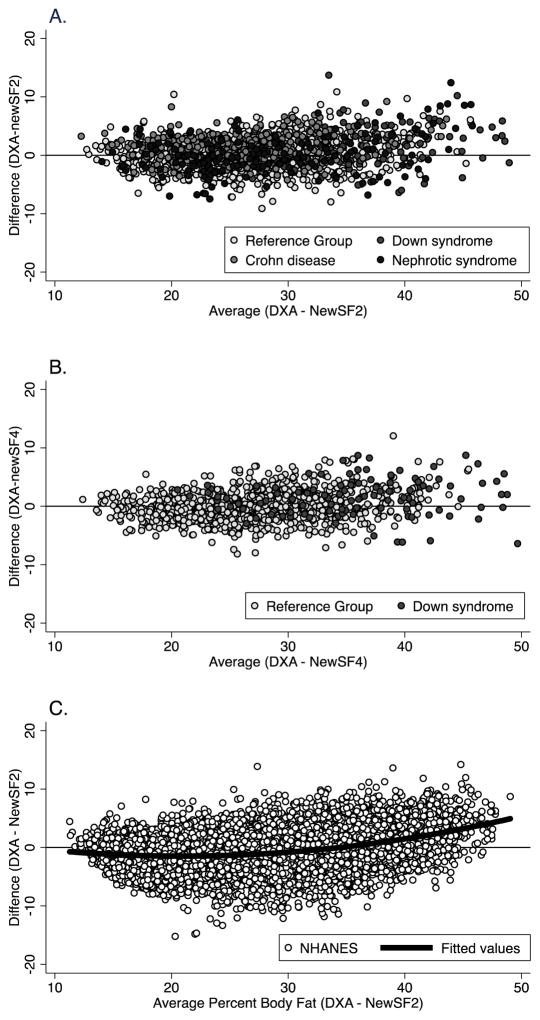
Figure 6.
Percent body fat agreement plot showing: A. the difference between DXA and 2 skinfold body composition prediction of percent body fat compared to the mean of DXA and predicted percent body fat in the healthy reference sample and in children with Down syndrome, Crohn disease, and steroid-sensitive nephrotic syndrome; B. the difference between DXA and 4 skinfold body composition prediction of percent body fat compared to the mean of DXA and predicted percent body fat in the healthy reference sample and in children with Down syndrome; C. the difference between DXA and 2 skinfold body composition prediction of percent body fat compared to the mean of DXA and predicted percent body fat in the NHANES data set.

