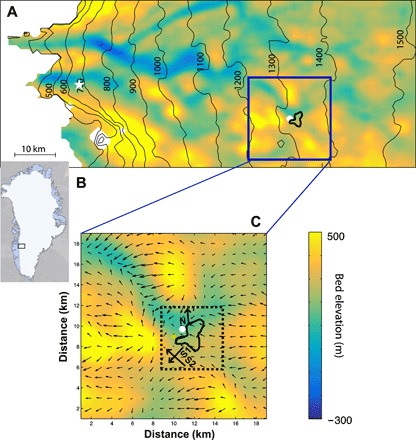
Fig. 1. Kangerlussuaq sector study site.

(A) Map of ice sheet bed elevation revealing the location of Lake F at the head of a major subglacial valley that ultimately extends to the western ice sheet margin. The outline of Lake F is shown by the solid black line, and the estimated input point of Lake F waters into the subglacial environment is shown by the filled white circle. The white star shows the location of site SHR referred to in the text. (B) Location of study region in Greenland. (C) Map of the hydraulic potential gradients and subglacial topography, where the length of arrows is proportional to the magnitude of flux. Seismic profiles N, S1, and S2 and their acquisition directions are indicated by thick black arrows. The dotted box indicates the 6 km × 6 km area over which sediment strengths and ice flow velocities in Fig. 5 were averaged.
