
Fig. 2. Seismic images of the ice sheet base.
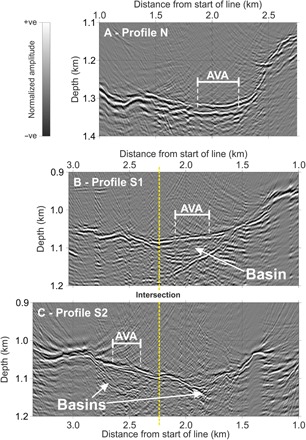
(A to C) Respective seismic structure of the ice sheet base along profiles N, S1, and S2 within a 300-m depth window. Automatic gain control, with a 300-ns window, was applied for display, and the yellow dashed lines show the intersections between profiles S1 and S2 in (B) and (C). Major subglacial sediment basins and the range of ice substrate reflectors supplied to our AVA analyses are indicated.