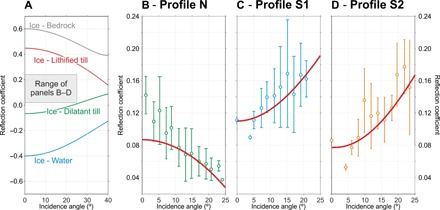
Fig. 3. AVA seismic analysis.

(A) Conceptual AVA curves for possible ice substrates (48), with range of panels (B to D) highlighted. (B to D) AVA data and uncertainty ranges derived respectively for profiles N, S1, and S2, where solid red lines are best fits from Bayesian modeling, as explained in Materials and Methods. The presence of lodged subglacial sediment is revealed in profile N, and an additional layer of thin dilatant sediment is indicated by composite reflections in profiles S1 and S2 (16).
