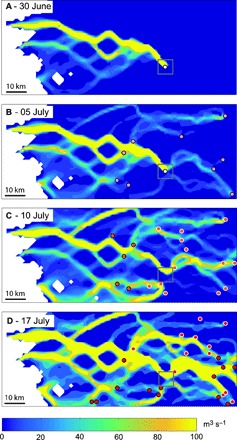
Fig. 4. Modeled cumulative fluxes due to supraglacial lake drainages in the 2010 melt season.

(A) On 30 June, showing fluxes due to Lake F drainage (white circle). (B) On 5 July, showing drainages on 30 June (Lake F, white circle) and 3 to 5 July (pink circles). (C) On 10 July, showing drainages on 6 July (orange circles with white border) and 10 July (orange circles with black border). (D) On 17 July, showing drainages on 11 to 16 July (red circles with black border) and 17 July (red circles with white border). The gray box outlines the 6 km × 6 km area over which sediment strength and ice velocity were averaged in Fig. 5.
