
Fig. 5. Modeled subglacial sediment strength and ice flow velocity, averaged over a 6 km × 6 km area centered on Lake F (dotted box in Fig. 1C).
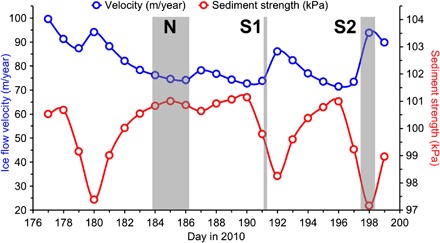
The gray shaded areas indicate the acquisition periods of our seismic profiles N, S1, and S2. Sediments are modeled to be strong and weak when profiles N and S1/S2, respectively, were acquired. Corresponding modeled subglacial water fluxes are shown in Fig. 4.