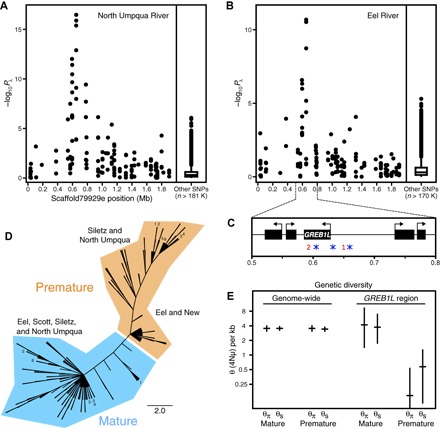
Fig. 2. Genetic and evolutionary basis of premature migration in steelhead.

Association mapping of migration category in (A) North Umpqua River and (B) Eel River steelhead. (C) Gene annotation of region with strong association; red numbers indicate genomic positions of two restriction sites flanked by strongest associated SNPs, and blue asterisks indicate positions of amplicon sequencing. (D) Phylogenetic tree depicting maximum parsimony of phased amplicon sequences from all individuals; branch lengths, with the exception of terminal tips, reflect nucleotide differences between haplotypes; numbers identify individuals with one haplotype in each migration category clade. (E) Genome-wide and GREB1L region diversity estimates in North Umpqua for each migration category with 95% confidence intervals from coalescent simulations.
