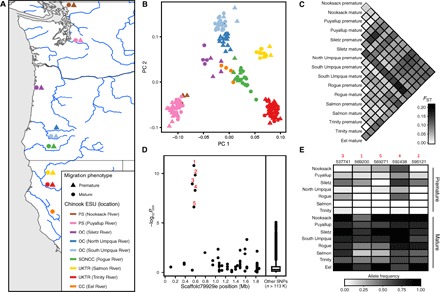
Fig. 3. Genetic and evolutionary basis of premature migration in Chinook.

(A) Map of Chinook sample locations and migration phenotypes; color indicates location, and shape indicates migration category. (B) PCA and (C) pairwise FST estimates using genome-wide SNP data. (D) Association mapping of migration category in Chinook; red numbers indicate significant SNPs. (E) Allele frequency shift at significant SNPs between premature and mature migrating populations. Black numbers indicate SNP position on scaffold79929e.
