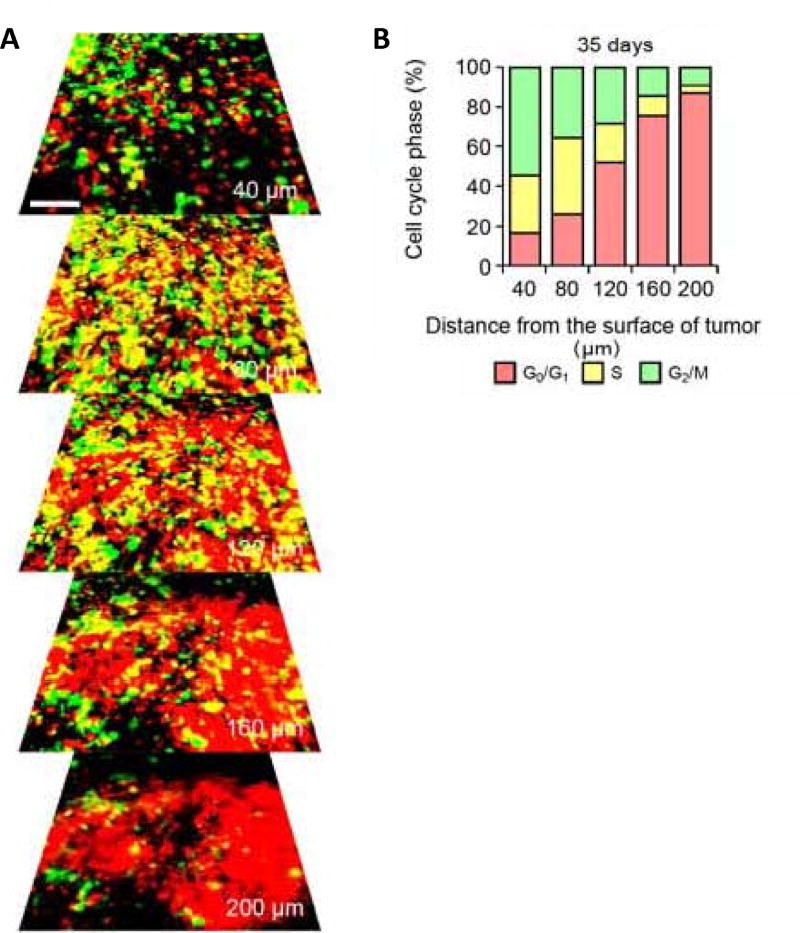
Figure 1. Cell cycle phase distribution of cancer cells at the tumor surface and center.
(A) FUCCI-expressing MKN45 cells were implanted directly in the liver of nude mice and imaged at day 35. (B) Histogram show the cell cycle distribution in the tumor at day 35 after implantation. Histogram shows the distribution of FUCCI-expressing cells at different distances from the center. Reproduced with permission from [13].

