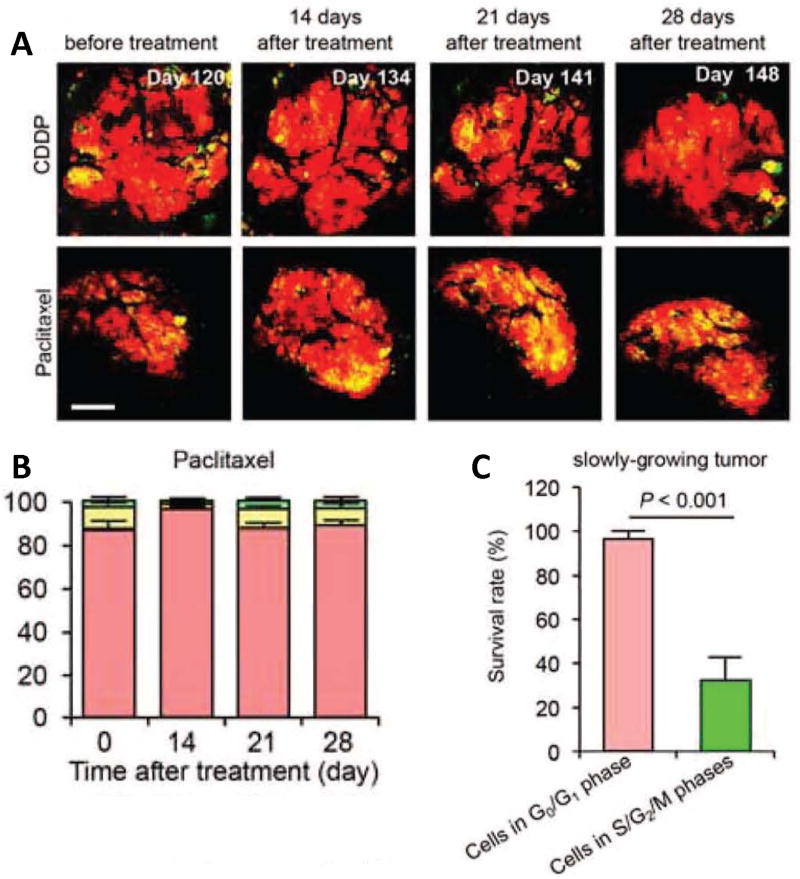
Figure 2. The efficacy of chemotherapy depends on the cell cycle phase distribution within the tumor.
(A) Representative images of slowly growing FUCCI-expressing tumor in the liver before and after CDDP or paclitaxel treatment. (B) Histogram show the cell-cycle phase distribution within the tumor at the indicated time points. (C) Histogram show the survival rate of the cancer cells in G0/G1 phase or in S/G2/M phases after chemotherapy. Scale bars = 500 µm Reproduced with permission from [13].

