. 2017 Jul 20;6:e29107. doi: 10.7554/eLife.29107

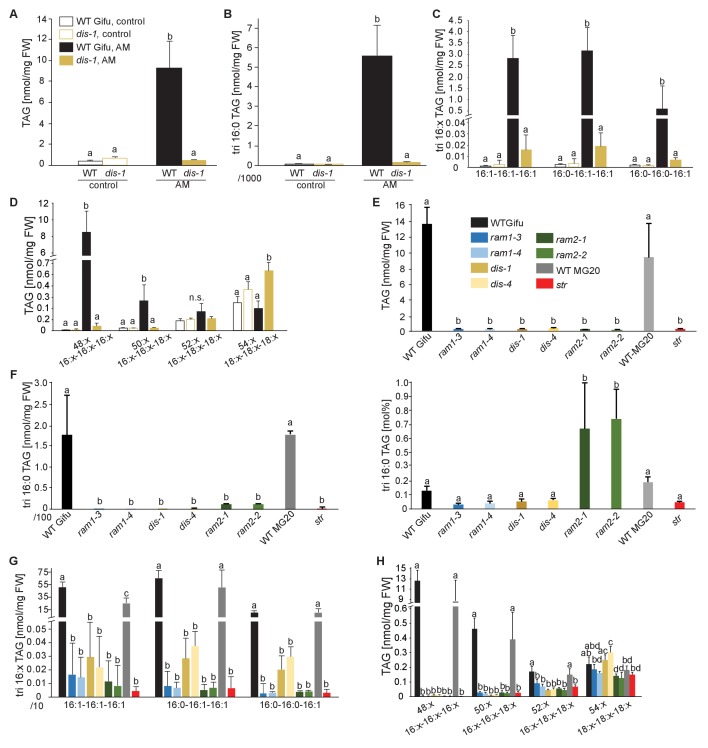
Figure 5. Lack of characteristic accumulation of triacylglycerols in AM-defective mutants.

(A-D) Quantitative accumulation of (A) total triacylglycerols, (B) tri16:0-triacylglycerol (C) tri16:x-triacylglycerols and (D) of triacylglycerols harbouring 16:x and 18:x FA-chains in non-colonized and R. irregularis colonized wild-type and dis-1 roots. Different letters indicate significant differences (ANOVA; posthoc Tukey) (A): n = 18; p≤0.001; F3,14 = 68.16. (B): n = 18; p≤0.001; F3,14 = 68.48. (C): n = 19; p≤0.01, F3,15 = 7.851 (16:1-16:1-16:1); p≤0.001, F3,15 = 14.52 (16:0-16:1-16:1); p≤0.001, F3,15 = 39.22 (16:0-16:0-16:1). (D): n = 19; p≤0.001, F3,15 = 12.15 (48:x), F3,15 = 15.56 (50:x); p≤0.01, F3,15 = 22.93 (54:x). (E-G) Quantitative accumulation of (E) total triacylglycerols, (F) tri16:0-triacylglycerols, (G) tri16:x-triacylglycerols and (H) of triacylglycerols harbouring 16:x and 18:x FA-chains in colonized roots of L. japonicus wild-type Gifu, wild-type MG-20 and arbuscule-defective mutants. Different letters indicate significant differences (ANOVA; posthoc Tukey). (E): n = 40; p≤0.001; F8,31 = 38.42. (F) Left: absolute tri16:0 TAG content: n = 40; p≤0.001; F8,31 = 19.05. Right: tri16:0 TAG proportion among all TAGs, n = 40; p≤0.001; F8,31 = 14.21. (G): p≤0.001; n = 41, F8,32 = 86.16 (16:1-16:1-16:1); n = 39, F8,30 = 24.16 (16:0-16:1-16:1); n = 40, F8,31 = 17.67 (16:0-16:0-16:1). (H): n = 40; p≤0.001, F8,31 = 39.26 (48:x), F8,31 = 28.93 (50:x); p≤0.01, F8,31 = 19.78 (52:x); p≤0.05, F8,31 = 13.77 (54:x). (A-H) Bars represent means ±standard deviation (SD) of 3–5 biological replicates.

DOI: http://dx.doi.org/10.7554/eLife.29107.022

Figure 5—source data 1. Raw data for lipid profiles in Figure 5 and Figure 5—figure supplements 13 and 511.
elife-29107-fig5-data1.xlsx (676.7KB, xlsx)
DOI: 10.7554/eLife.29107.023

Figure 5.

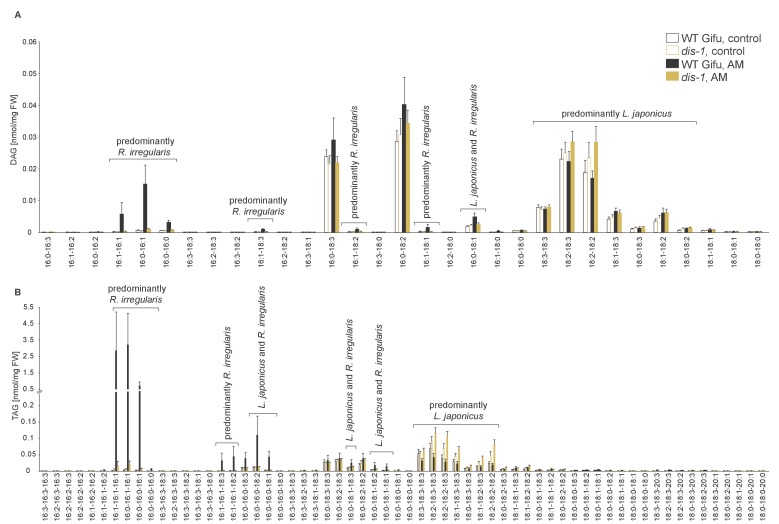
Figure 5—figure supplement 1. Diacylglycerol (DAG) and triacylglycerol (TAG) profiles of L. japonicus WT and dis-1 control and AM roots.

Figure 5—figure supplement 1.

(A) Profile of diacylglycerols in control and AM-colonized L. japonicus WT and dis-1 roots. (B) Profile of triacylglycerols in control and AM-colonized L. japonicus WT and dis-1 roots. (A–B) Bars represent means ±standard deviation (SD) of 3–5 biological replicates. ‘L. japonicus and R. irregularis’ marks lipids which are found in both organisms according to (Wewer et al., 2014) .
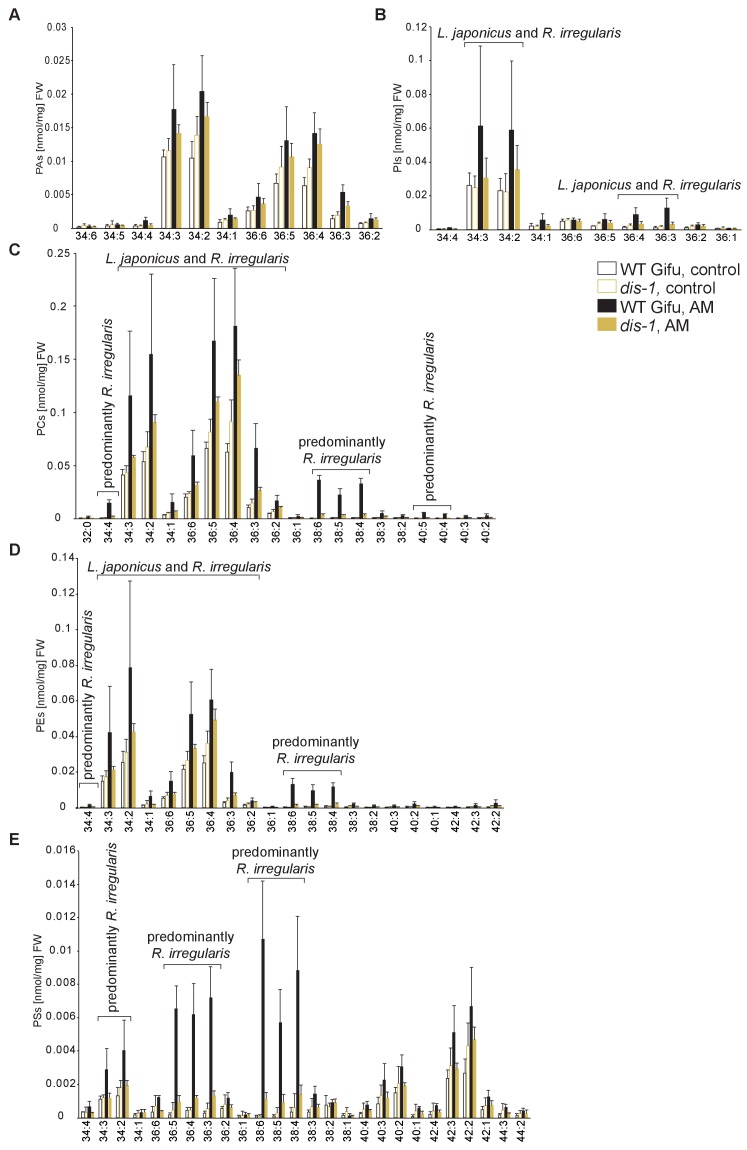
Figure 5—figure supplement 2. Profiles of phospholipids in non-colonized and colonized L. japonicus WT Gifu and dis-1 roots.

Figure 5—figure supplement 2.

(A) Absolute amounts of phosphatidic acid (PA) species. (B) Absolute amounts of phosphatidylinositol (PI) species. (C) Absolute amounts of phosphatidylcholine (PC) species. (D) Absolute amounts of phosphatidylethanolamine (PE) species. (E) Absolute amounts of phosphatidylserine (PS) species. (A–D) Bars represent means ±standard deviation (SD) of 3–5 biological replicates. ‘L. japonicus and R. irregularis’ marks lipids which are found in both organisms according to Wewer et al. (2014).
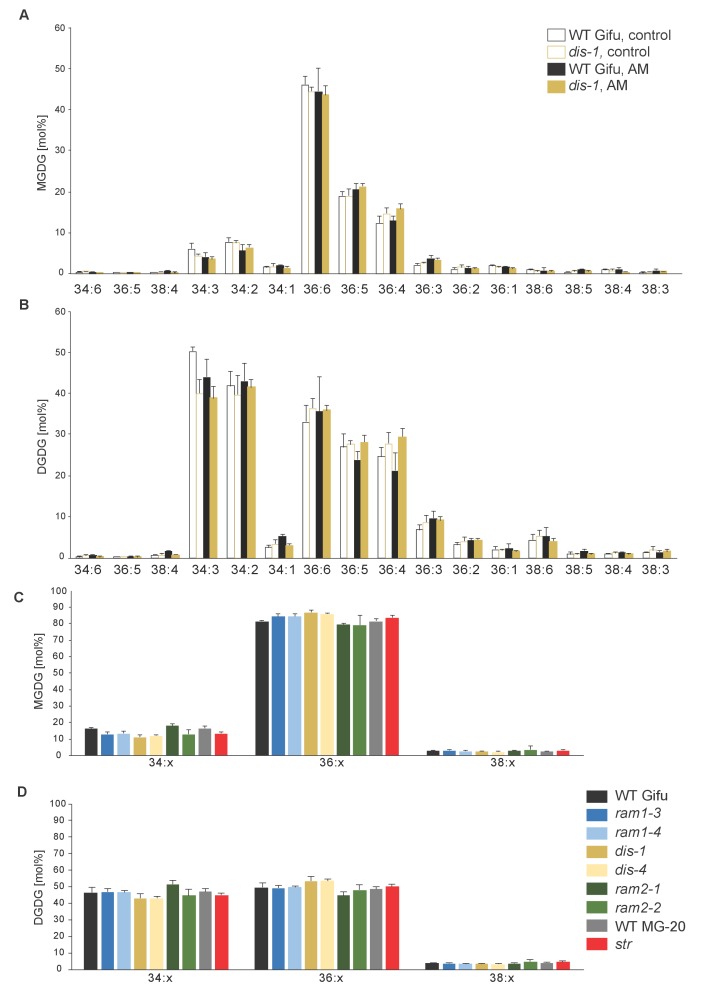
Figure 5—figure supplement 3. MGDG and DGDG profiles do not differ among L. japonicus wild-type and mutant roots.

Figure 5—figure supplement 3.

(A) Relative amounts of monogalactosyldiacylglycerol (MGDG) in control and colonized roots of Gifu WT and dis-1. (B) Relative amount of digalactosyldiacylglycerol (DGDG) in control and colonized roots of Gifu WT and dis-1. (C) Relative amounts of monogalactosyldiacylglycerols (MGDG) containing acyl chains of 16:x + 18:x(34:x MGDG), di18:x(36:x MGDG) or 18:x + 20:x(38:x MGDG) in the different colonized genotypes. (D) Relative amount of digalactosyldiacylglycerols (DGDG) containing acyl chains of 16:x + 18:x(34:x DGDG), di18:x(36:x DGDG) or 18:x + 20:x(38:x DGDG) of the different colonized genotypes. (A–D) Bars represent means ±standard deviation (SD) of 3–5 biological replicates.
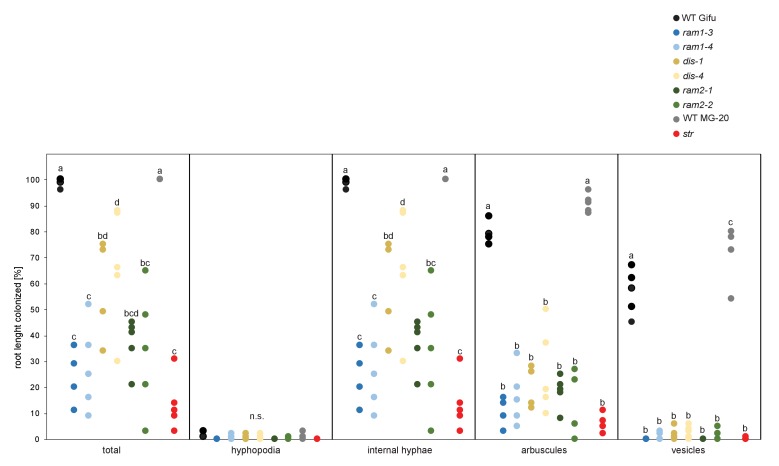
Figure 5—figure supplement 4. All arbuscule-deficient mutants show reduced root length colonization.

Figure 5—figure supplement 4.

Quantitative AM colonization in root samples employed for lipidomics (Figure 3D–F, Figure 5E–H, Figure 7Figure 5—figure supplements 13 and 511) as determined by modified grid-line intersect methods after acid-ink staining. WT Gifu, WT MG-20 and all AM-deficient mutants in the Gifu background (ram1-3, ram1-4, dis-1, dis-4, ram2-1 and ram2-2) and the str mutant in the MG-20 background. Different letters indicate significant differences (ANOVA; posthoc Tukey; n = 45) among genotypes for each fungal structure separately. p≤0.05, F8,36 = 21.69 (total and intraradical hyphae); p≤0.001, F8,36 = 62.1 (arbuscules), F8,36 = 176.5 (vesicles).
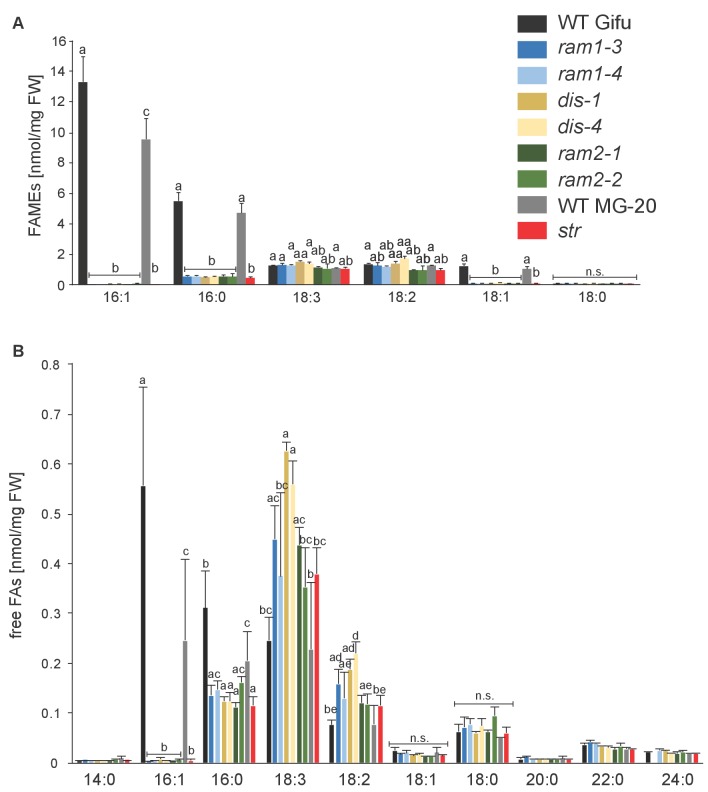
Figure 5—figure supplement 5. Total fatty acid and free fatty acid profiles of colonized L. japonicus WT and AM-defective mutant roots.

Figure 5—figure supplement 5.

(A) Total amounts of fatty acids (FAME) in colonized L. japonicus roots of the different genotypes. Fatty acid methyl esters (FAME) were prepared from total root lipids and analysed by GC. Different letters indicate significant differences (ANOVA; posthoc Tukey; p≤0.01; (n = 42, F8,33 = 29.91 (16:1); n = 43, F8,34 = 20.25 (16:0); n = 43, F8,34 = 11.34 (18:3); F8,34 = 13.14 (18:2)). (B) Free fatty acid composition in colonized L. japonicus roots from Gifu WT, MG-20 WT, ram1-3, ram1-4, dis-1, dis-4, ram2-1, ram2-2 and str. Free fatty acids were isolated from total root lipids and converted into fatty acid methyl esters for quantification by GC Different letters indicate significant differences (ANOVA; posthoc Tukey; n = 44; (p≤0.001, F8,35 = 230.6 (16:0); p≤0.001, F8,35 = 257.7 (16:1); F8,35 = 222.5 (18:1); F8,35 = 15.48 (18:2); F8,35 = 8.225 (18:3)). (A–B) Bars represent means ±standard deviation (SD) of 3–5 biological replicates.
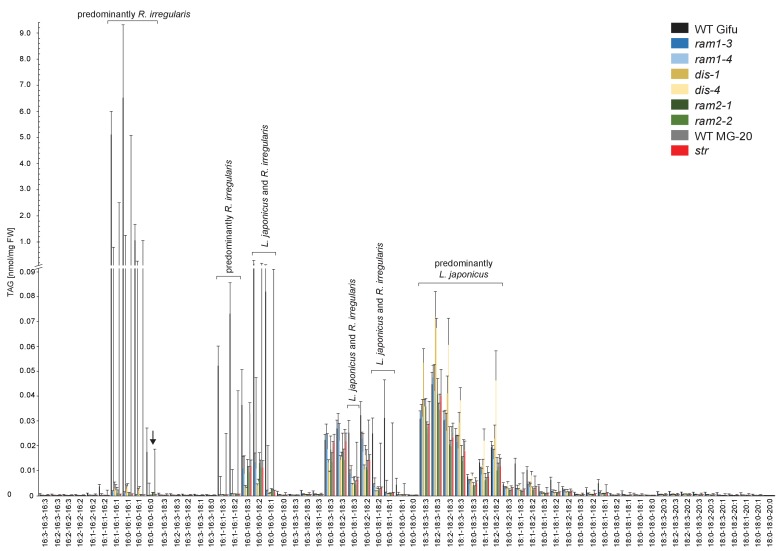
Figure 5—figure supplement 6. Triacylglycerol (TAG) profiles of colonized L. japonicus WT and AM-defective mutant roots.

Figure 5—figure supplement 6.

Absolute amounts of triacylglycerol molecular species in colonized L. japonicus roots of WT Gifu, WT MG-20 ram1-3, ram1-4, dis-1, dis-4, ram2-1, ram2-2 and str. Black arrow indicates accumulation of tri 16:0 TAG in ram2-1 and ram2-2. Bars represent means ±standard deviation (SD) of 3–5 biological replicates.
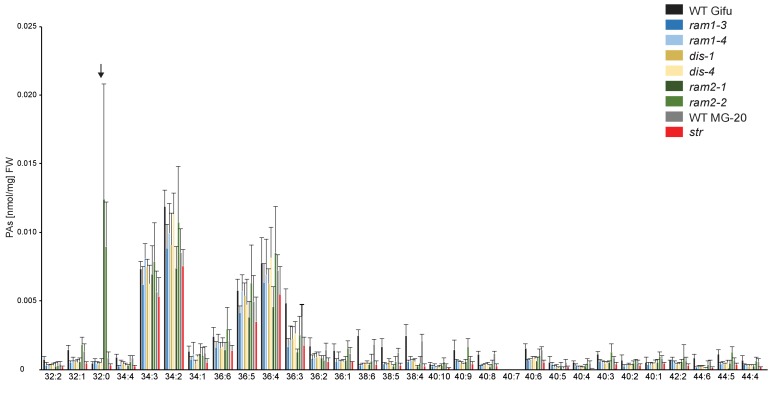
Figure 5—figure supplement 7. Phosphatidic acid (PA) profiles in L. japonicus WT and AM-defective mutants.

Figure 5—figure supplement 7.

Absolute amounts of phosphatidic acid molecular species in colonized L. japonicus roots of WT Gifu, WT MG-20 ram1-3, ram1-4, dis-1, dis-4, ram2-1, ram2-2 and str. Black arrow indicates accumulation of 32:0 (di16:0) PA in ram2-1 and ram2-2. Bars represent means ±standard deviation (SD) of 3–5 biological replicates.
Figure 5—figure supplement 8. Profile of phosphatidylcholines (PC) in L. japonicus WT and AM-defective mutants.

Figure 5—figure supplement 8.

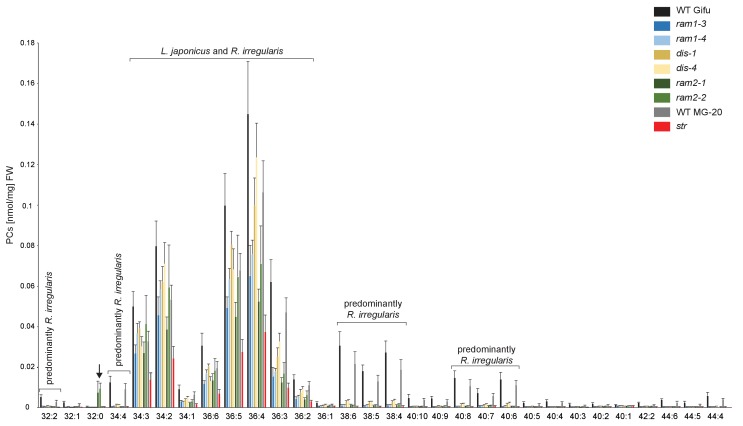
Absolute amounts of phosphatidylcholine molecular species in colonized L. japonicus roots of WT Gifu, WT MG-20, ram1-3, ram1-4, dis-1, dis-4, ram2-1, ram2-2 and str. Bars represent means ±standard deviation (SD) of 3–5 biological replicates. ‘L. japonicus and R. irregularis’ marks lipids which are found in both organisms according to Wewer et al. (2014). Arrow highlights the exclusive accumulation of unusual 32:0 (di16:0) PC in ram2-1 and ram2-2.
Figure 5—figure supplement 9. Phosphatidylethanolamine (PE) profile in L. japonicus WT and AM-defective mutants.

Figure 5—figure supplement 9.

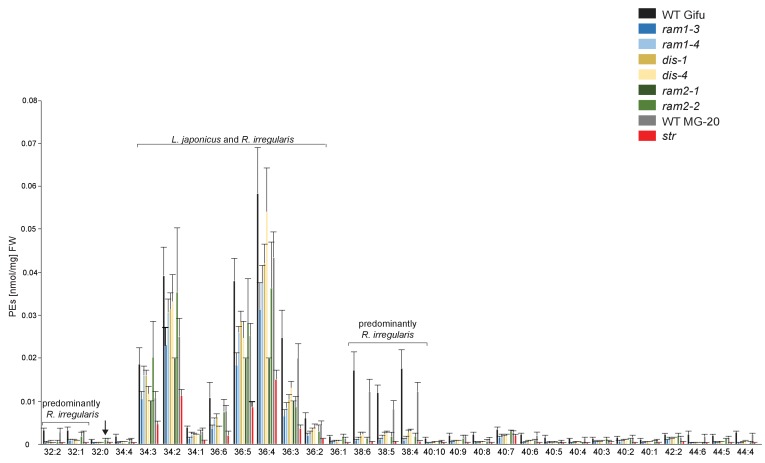
Absolute amounts of phosphatidylethanolamine molecular species in colonized L. japonicus roots of WT Gifu, WT MG-20, ram1-3, ram1-4, dis-1, dis-4, ram2-1, ram2-2 and str. Bars represent means ±standard deviation (SD) of 3–5 biological replicates. ‘L. japonicus and R. irregularis’ marks lipids which are found in both organisms according to Wewer et al. (2014). Arrow highlights the exclusive accumulation of unusual 32:0 (di16:0) PE in ram2-1 and ram2-2.
Figure 5—figure supplement 10. Phosphatidylinositol (PI) profile in L. japonicus WT and AM-defective mutants.

Figure 5—figure supplement 10.

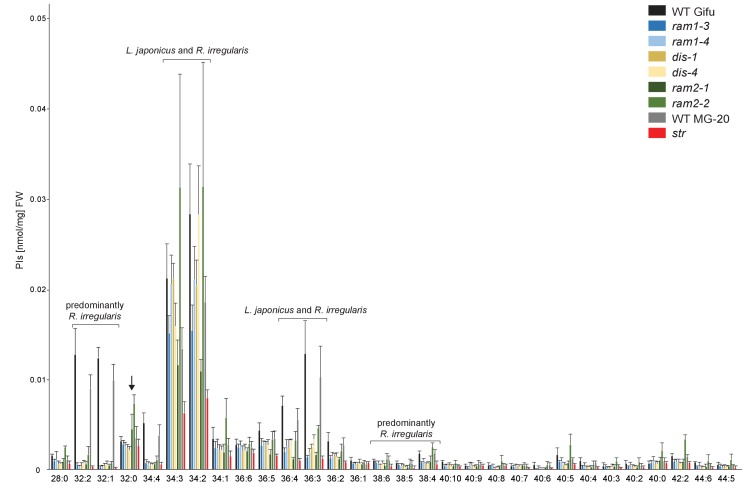
Absolute amounts of phosphatidylinositol molecular species in colonized L. japonicus roots of WT Gifu, WT MG-20, ram1-3, ram1-4, dis-1, dis-4, ram2-1, ram2-2 and str. Bars represent means ± standard deviation (SD) of 3–5 biological replicates. ‘L. japonicus and R. irregularis’ marks lipids which are found in in both organisms according to Wewer et al. (2014). Arrow highlights the exclusive accumulation of unusual 32:0 PI in ram2-1 and ram2-2.
Figure 5—figure supplement 11. Phosphatidylserine (PS) profile in L. japonicus WT and AM-defective mutants.

Figure 5—figure supplement 11.

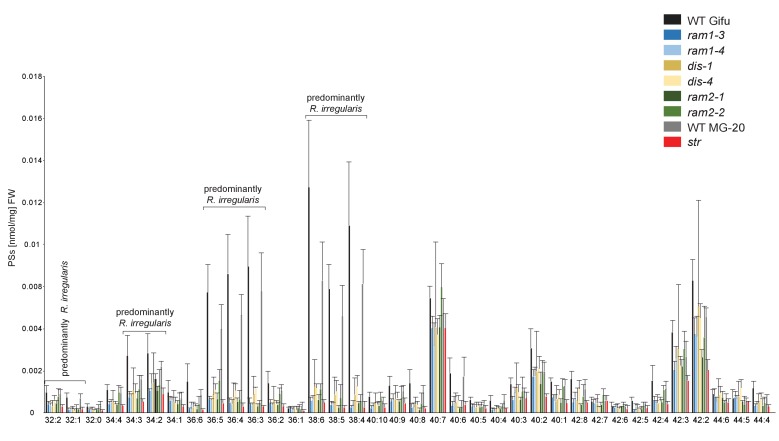
Absolute amounts of phosphatidylserine molecular species in colonized L. japonicus roots of WT Gifu WT, WT MG-20, ram1-3, ram1-4, dis-1, dis-4, ram2-1, ram2-2 and str. Bars represent means ± standard deviation (SD) of 3–5 biological replicates.