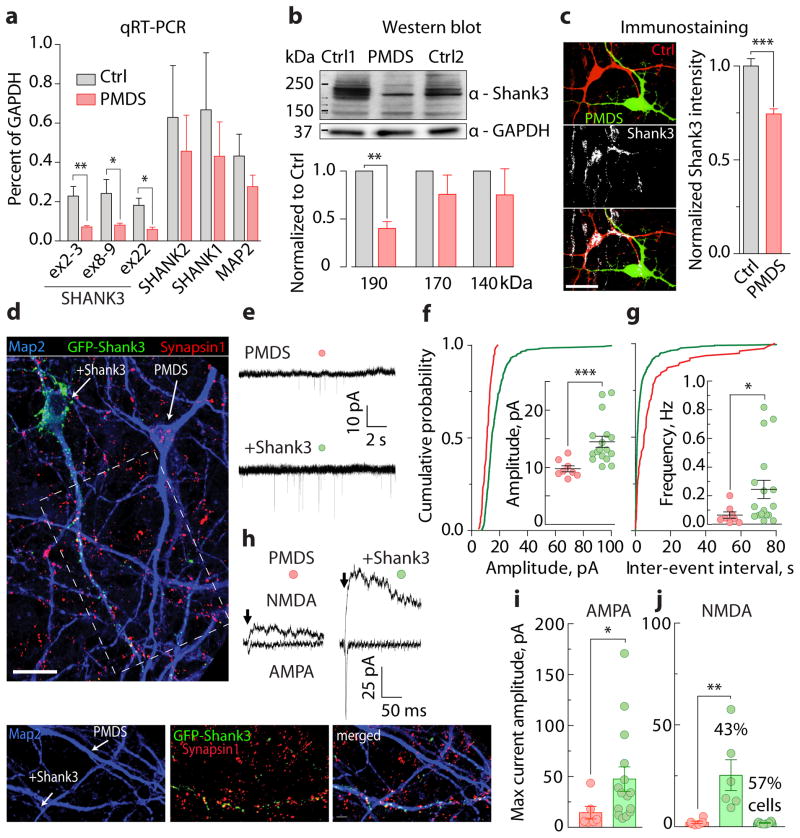
Figure 4. Reduced Shank3 expression contributs to synaptic defects in PMDS neurons.
a, Relative expression of SHANK1, SHANK2, SHANK3, and MAP2 mRNAs in iPSC-derived neurons (D30 – D35; n = 5 control and 6 PMDS biological replicates; * p < 0.05, ** p < 0.01, Student’s t-test). b, Quantification of Shank3 expression in control and PMDS neurons as assessed by Western blot (D45 – 50; n = 4 pairs of samples; ** p < 0.01, one-sample t-test). GAPDH was used as a loading control. c, Images (left) and quantification (right) of Shank3 expression in co-cultured control (red) and PMDS (green) neurons (scale bar = 20 μm). d, Images of PMDS neurons infected with GFP-Shank3 lentiviruses and immunostained with antibodies against Map2, GFP, and Synapsin1 (scale bars = 20 (top) and 5 (bottom) μm). e, Traces of spontaneous EPSCs recorded from uninfected and Shank3-infected PMDS neurons at −70 mV. f–g, Cumulative distribution and quantification of amplitude (f) and frequency (g) of spontaneous EPSCs (n = 8 uninfected and 17 Shank3-infected cells). h, Traces of evoked AMPA- (Vh = −70 mV) and NMDA-EPSCs (Vh = +60 mV). i–j, Quantification of maximum amplitudes of evoked AMPA- (i, measured at peak) and NMDA-EPSCs (j, measured 50 ms post stimulus) recorded from uninfected (n = 6) and Shank3-infected (n = 14) PMDS neurons. Data presented as means ± SEMs; * p < 0.05, *** p < 0.001, Mann-Whitney test.

