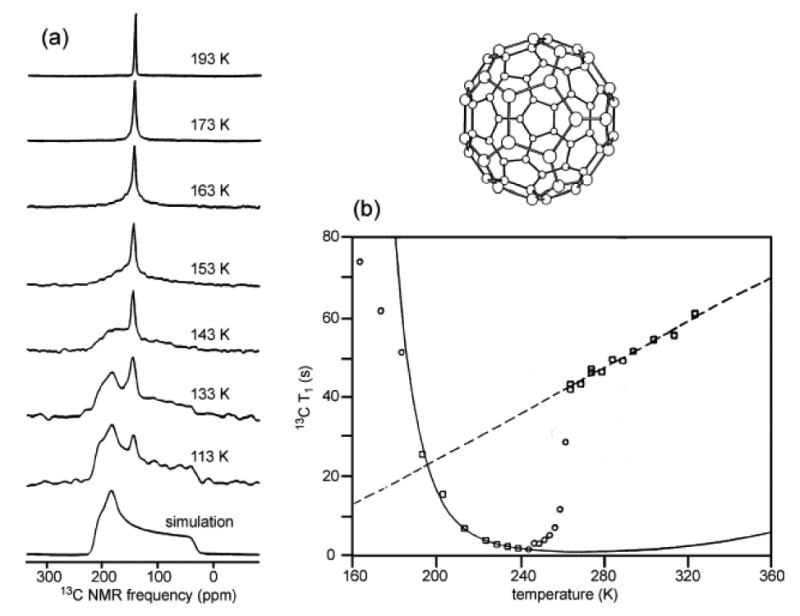
Figure 1.

(a) 13C NMR spectra of polycrystalline C60 at the indicated temperatures and 9.39 T, compared with the simulated chemical shift anisotropy powder pattern line shape for immobilized molecules. (b) Experimental temperature dependence of the spin-lattice relaxation time (squares and circles) and best-fit theoretical curves for low-temperature and high-temperature phases (solid and dashed lines, respectively) with different activation energies for molecular reorientation. [reprinted from Phys. Rev. Lett. 67, 1886 (1991)].
