
Figure 6.
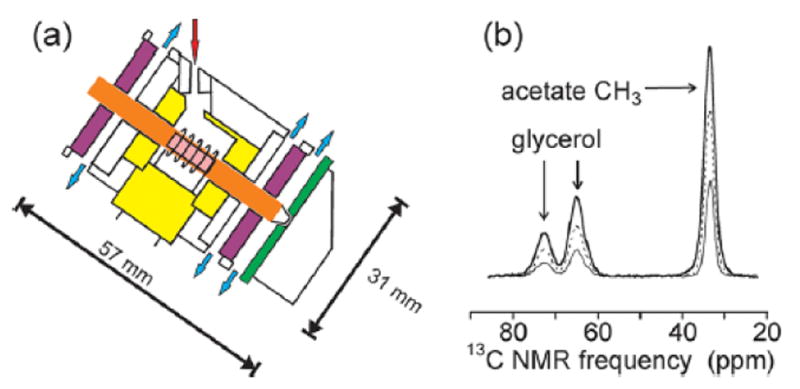
(a) Diagram of MAS module for ultra-low-temperature solid state NMR experiments. The rotor (orange) is supported by bearings (purple) and spun by a stator (green) that are driven by nitrogen gas, which exits as indicated by blue arrows. Cold helium (red arrow) enters the space around the rf coil and sample (pink) that is defined by the teflon insert (yellow) and exits along the outer surface of the rotor, toward the bearings. (b) 13C MAS spectra of 13CH3-labeled sodium acetate in glycerol/water at 25 K (heavy solid line), 40 K (dashed line), and 79 K (thin solid line), recorded at 9.39 T with 7.00 kHz MAS.