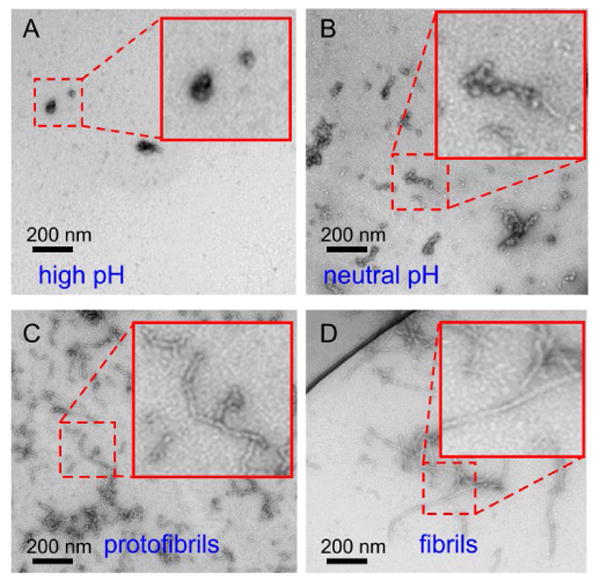
Figure 1.

Negatively stained TEM images of Aβ40 at four stages of self-assembly. (A) “High pH” sample, after initial preparation of an Aβ40 solution at pH 12. (B) “Neutral pH” sample, shortly after adjustment to pH 7.5. (C) “Protofibril” sample, after 4 h incubation at pH 7.5. (D) “Fibril” sample, after four rounds of sonication and incubation. Insets are expanded views of the indicated regions.
