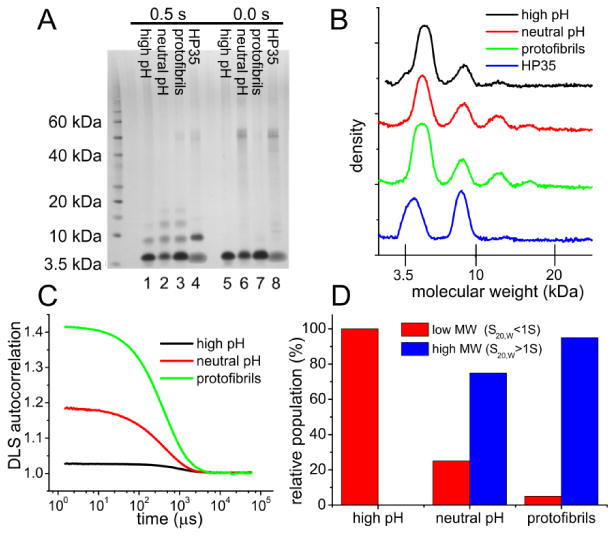
Figure 2.

Biophysical characterization of Aβ40 assemblies. (A) SDS-PAGE gel of Aβ40 assemblies after PICUP cross-linking with 0.5 s and 0.0 s light exposure times. A 2 mM solution of the 4.06 kDa protein HP35 in 50 mM phosphate buffer at pH 7.4 is used as a non-aggregating control. (B) Stain density profiles from lanes 1-4 of the SDS-PAGE gel. (C) DLS autocorrelation functions, with the amplitudes before 10 μs indicating the relative concentrations of large aggregates. (D) Populations of small (sedimentation coefficient S20,w< 1 S) and large (S20,w > 1 S) species determined by sedimentation velocity measurements. Here S20,wrepresents the sedimentation coefficient normalized to the standard conditions of 20° C and pure water solvent.
