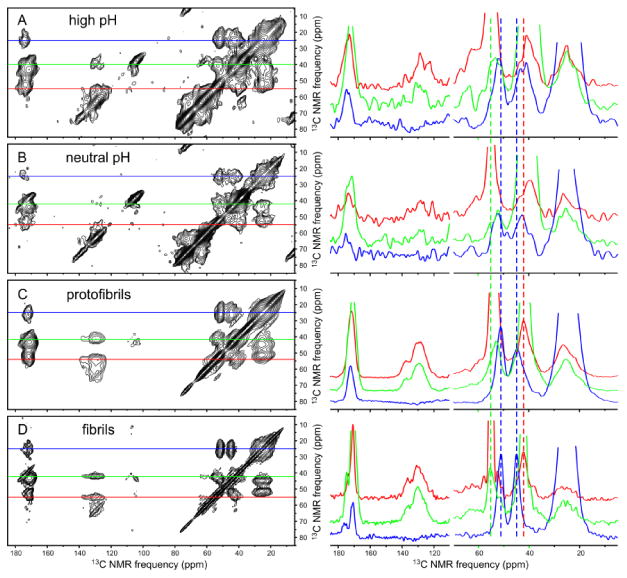
Figure 5.

DNP-enhanced 2D 13C ssNMR spectra of Aβ40 assemblies with isotopic labeling pattern I. (A) High pH sample, acquired with 5.6 s recycle delay, 2.7 ms maximum t1 period, total measurement time of 5.0 h, processed with 150 Hz Gaussian apodization in both dimensions. (B) Neutral pH sample, acquired with 5.7 s recycle delay, 2.7 ms maximum t1 period, total measurement time of 5.0 h, and 150 Hz Gaussian apodization. (C) Protofibril sample, acquired with 10.0 s recycle delay, 3.9 ms maximum t1 period, total measurement time of 1.5 h, and 50 Hz Gaussian apodization. (D) Fibril sample, acquired with 10.2 s recycle delay, 3.9 ms maximum t1 period, total measurement time of 1.7 h, and 50 Hz Gaussian apodization. 1D slices at 13C chemical shifts of L34 Cγ (blue), F19 Cβ (green), and F19 Cα (red) are shown to the right of each 2D spectrum. Vertical dashed lines indicate peak positions in the fibril spectrum. Samples were in frozen glycerol/water at 25 K with triradical dopants. Spectra were acquired with 6.7 kHz MAS and 23.8 ms spin diffusion mixing periods between t1 and t2 periods. Contour levels increase by successive factors of 1.3.
