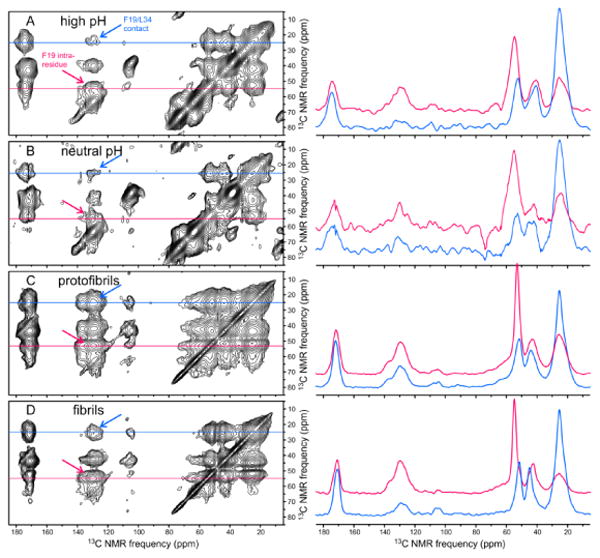
Figure 7.

DNP-enhanced 2D 13C ssNMR spectra of Aβ40 assemblies, obtained with 2.1 s RAD mixing periods. (A-D) Spectra of high pH, neutral pH, protofibril, and fibril samples, with 1D slices at 13C chemical shifts of L34 Cγ(red) and F19 Cα (blue) shown to the right of each 2D spectrum. Samples were prepared with isotopic labeling pattern I. Sample temperatures, MAS frequencies, maximum t1 periods, and recycle delays were as in Figure 4. Total measurement times were 5.0 h, 5.0 h, 1.7 h, and 3.0 h, respectively. Gaussian apodizations were 250 Hz, 250 Hz, 150 Hz, and 150 Hz, respectively. Blue arrows indicate inter-residue crosspeaks between F19 aromatic and L34 aliphatic signals. Red arrows indicate crosspeaks between F19 aromatic and F19 Cα signals.
