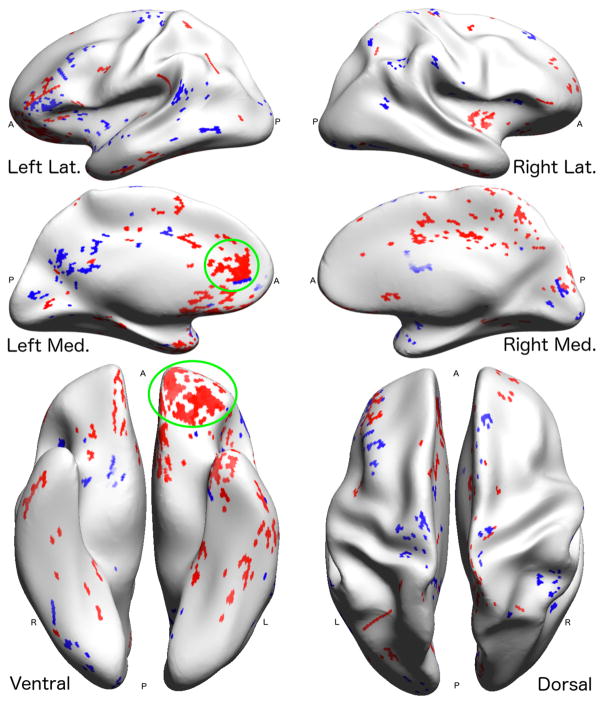
Figure 3.
A visualization of the significant differences of marginal connectivity (Eq. 3) values by mesh vertex between healthy normal human males and human females, controlled for age and inter-cranial volume, taking a critical value of α = 0.05, using the Benjamini–Hochberg [28] False Discovery Rate (FDR) correction for multiple comparisons. The marginal connectivity M(x) is the rate at which we observe tracts which have one endpoint at x. Regions of significant difference are thus interpreted as areas in which observed tracts are more likely to be incident in one group than in another. Note that the medial wall was removed and not tested. The results have been projected from registered space to a smoothed exemplar subject.
 denotes significantly higher marginal connectivity in females,
 denotes significantly higher marginal connectivity in males. Annotations in
 denote the anterior cingulate (top) and the inferior pre-frontal cortex (bottom), regions with large areas of significance.

