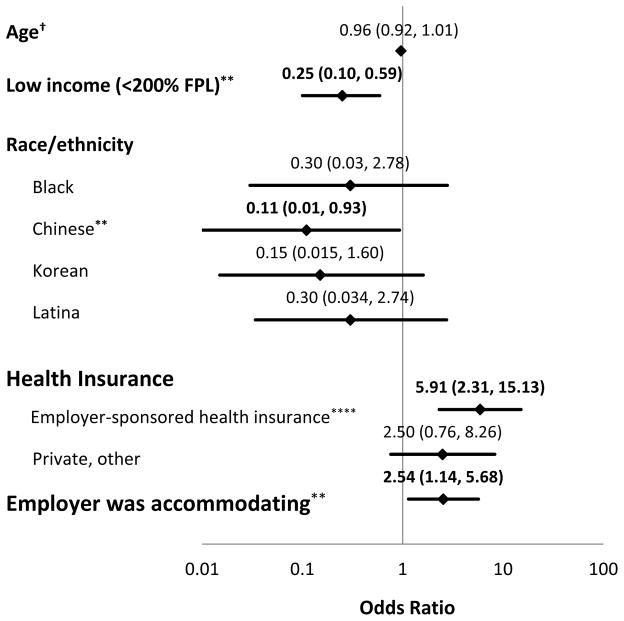
Exhibit 4. Model describing the odds of job retention.
Independent predictors of job retention among study participants
Source: Authors’ analysis of data from the Breast Cancer and the Workforce study
Notes: Diamond indicates point estimate for odds ratio; horizontal line indicates 95% confidence interval.
Corresponding data are included above each data point as OR (95% confidence interval). FPL: Federal Poverty Level †Odds ratio corresponds to a one-year increase in age.
**p <0.05, ***p <0.01, ****p <0.001
| Covariate | data points | position on y-axis | |
|---|---|---|---|
| Age | upper limit | 1.01 | 11 |
| odds ratio | 0.96 | 11 | |
| lower limit | 0.92 | 11 | |
| Low Income (<200% FPL) | upper limit | 0.59 | 10 |
| odds ratio | 0.25 | 10 | |
| lower limit | 0.1 | 10 | |
| Race/ethnicity | |||
| Black | upper limit | 2.78 | 8 |
| odds ratio | 0.3 | 8 | |
| lower limit | 0.03 | 8 | |
| Chinese | upper limit | 0.93 | 7 |
| odds ratio | 0.11 | 7 | |
| lower limit | 0.01 | 7 | |
| Korean | upper limit | 1.6 | 6 |
| odds ratio | 0.15 | 6 | |
| lower limit | 0.015 | 6 | |
| Latina | upper limit | 2.74 | 5 |
| odds ratio | 0.3 | 5 | |
| lower limit | 0.034 | 5 | |
| Health insurance | |||
| Employer sponsored | upper limit | 15.13 | 3 |
| odds ratio | 5.91 | 3 | |
| lower limit | 2.31 | 3 | |
| Other private | upper limit | 8.26 | 2 |
| odds ratio | 2.5 | 2 | |
| lower limit | 0.76 | 2 | |
| Employer was acccommodating | upper limit | 5.68 | 1 |
| odds ratio | 2.54 | 1 | |
| lower limit | 1.14 | 1 | |

