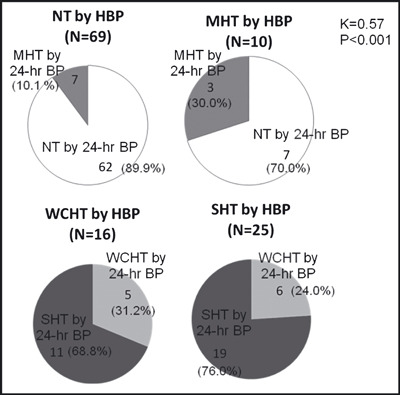
Figure 3.

The relationships between hypertensive groups defined by home blood pressure (HBP) and those defined by 24‐hour average blood pressure (BP). Data are shown as the numbers (percentages) of subjects in the hypertensive groups defined by HBP, or the numbers (percentages) of subjects classified in the hypertensive groups by 24‐hour ambulatory BP. K indicates kappa statistic; MHT, masked hypertension; NT, normotension; SHT, sustained hypertension; WCHT, white coat hypertension.
