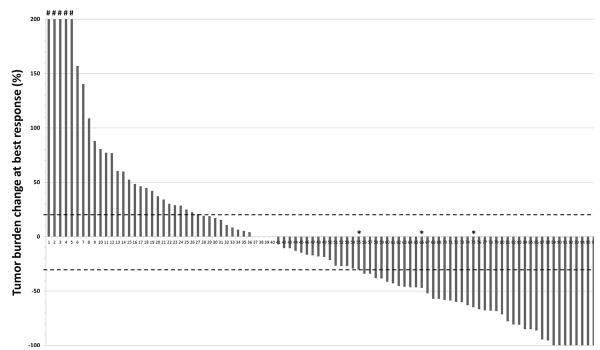
Fig. 1.
A waterfall plot of the tumor burden change of target lesions at best response (%) in reference to the baseline tumor burden in 96 patients with measurable tumor burden. Three patients noted with the asterisks experienced tumor response ≥30% decrease from baseline after experiencing initial tumor burden increase (pseudoprogression). Five patients noted with # had tumor burden increase beyond +200% (range: 211-566%). While 8 patients achieved CR for the target lesions (-100% of baseline), 3 of them had non-target lesions that did not completely respond and thus had PR for the best overall response assessment. Dotted lines at +20% and -30% represent the threshold for progression (PD) and partial response (PR).

