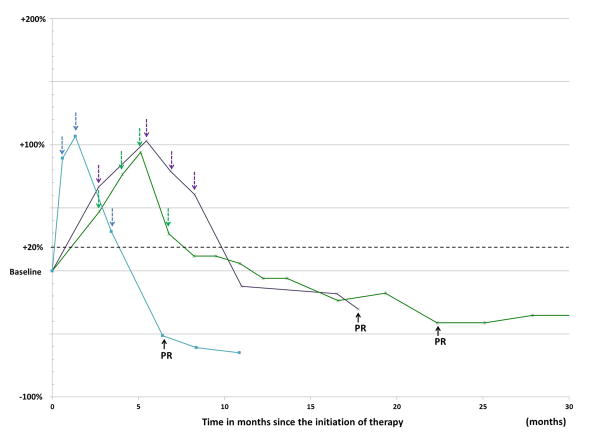
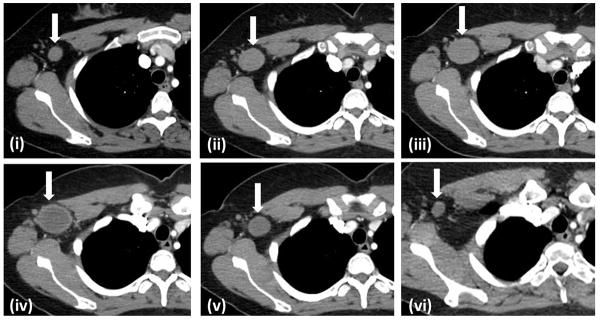
Fig. 4.
Pseudoprogressors with measurable tumor burden. A. The spider plot of tumor burden changes of 3 pseudoprogressors. All patients experienced more than 2 consecutive scans confirming PD (colored arrows) over the period longer than 4 weeks, thus meeting criteria for irPD, before achieving response to therapy (black arrows). B. A 38-year-old female with advanced melanoma with pseudoprogression, corresponding to a green line in Fig. 4A. A baseline scan showed a right axillary lymph node measuring 1.7 cm in short axis (i, arrow). The lesion increased in size on the 1st at 2.7 months (ii) and 2nd follow-up scans at 4.1 months (iii), demonstrating increase in size of the lesion more than 20% from baseline, confirming irPD. The lesion reached its maximal size at the 3rd follow-up scan at 5.5 months (iv), and then started to decrease in size on the 4th scan at 6.7 months (v). The lesion further decreased in size gradually, and met the criteria for response at 22.3 months of therapy (vi). Since then, the lesion remained small and maintained durable response over 19 months.


