
Figure 2. Size distributions and particle concentrations in exosome #4 fractions isolated from plasma of HNC patients and NDs.
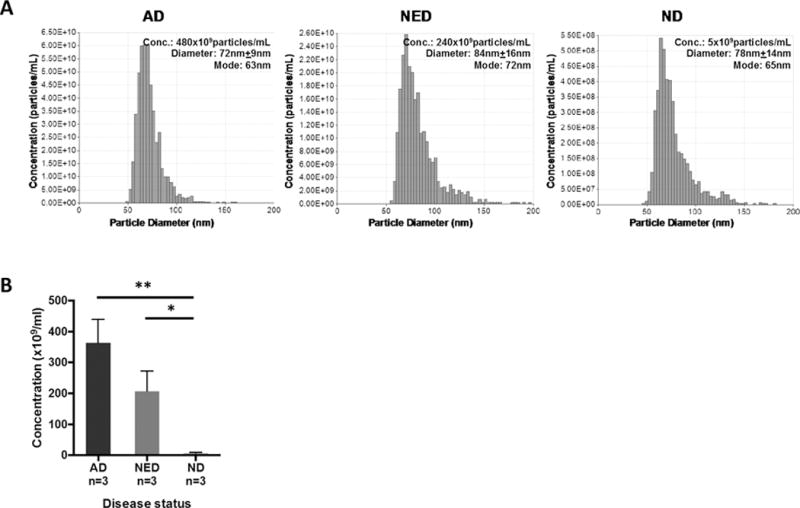
In (A), representative data obtained with fraction #4 exosomes from AD, NED or ND plasma show the same size distribution, while numbers of the recovered particles are highest in the AD #4 fraction. In (B), the combined data for 3 different exosome donors in each cohort are shown. The mean particle concentration is highest in AD patients, intermediate in NED and lowest in NDs (**AD vs. ND p<0.01; * NED vs. ND p<0.05). The data are mean values ± SEM.