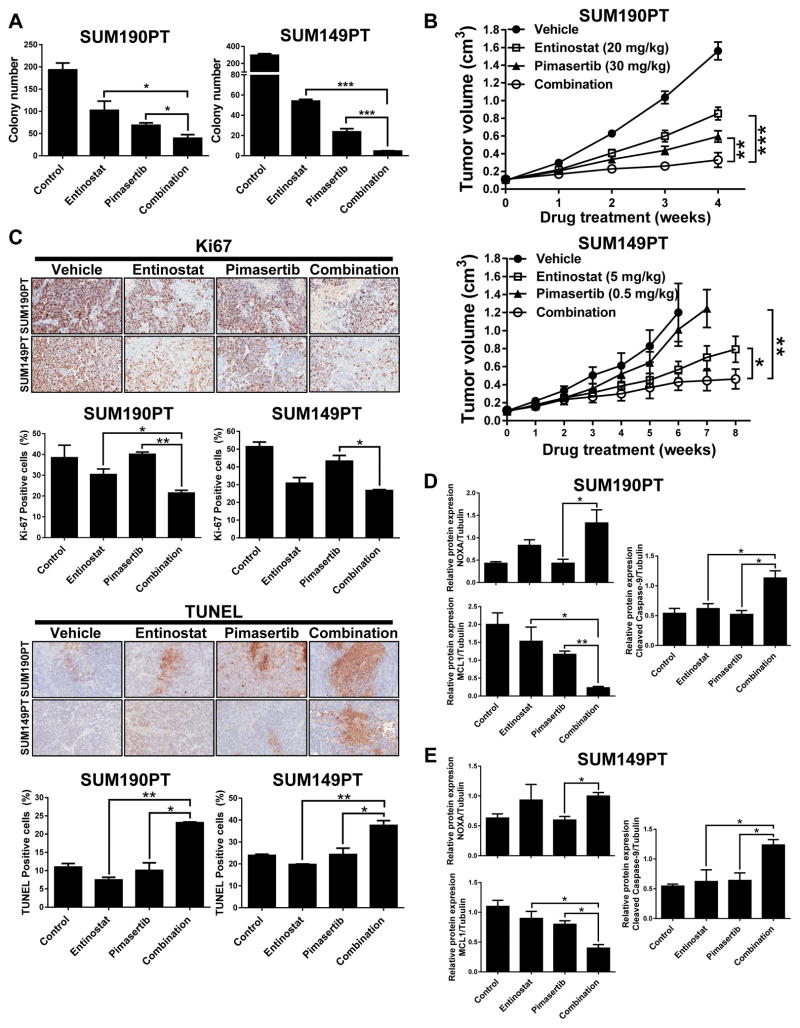
Figure 6. Entinostat and pimasertib combination treatment inhibits colony formation in vitro and tumor growth in vivo by NOXA-mediated apoptosis and decreased expression of MCL1.
SUM190PT and SUM149PT cell lines were treated with entinostat (0.01 and 0.05 μM, respectively) and/or pimasertib (0.01 and 0.05 μM, respectively) and allowed to grow in an anchorage-independent environment for 2–3 weeks; clonal growth was measured at the treatment endpoint by colony formation (A). Data were pooled from three independent experiments and presented as mean ± SEM. Tumor volume measurements for SUM190PT and SUM149PT tumor xenograft-bearing mice (n=12/group and 10/group, respectively) treated via oral gavage daily for up to 2 months with vehicle, entinostat (20 or 5 mg/kg), and/or pimasertib (30 or 0.5 mg/kg) (B). C, Immunohistochemistry (IHC) staining from SUM190PT and SUM149PT tumor xenografts treated with vehicle or the indicated drugs. Paraformaldehyde-fixed paraffin sections were incubated with anti-Ki-67 antibody, and TUNEL staining was performed. Representative images of 5 IHC staining experiments are illustrated. Magnification, 20x. The images were converted by ImageJ software to accomplish quantification of Ki-67 and TUNEL expression. Quantification of IHC staining is represented as mean ± SEM. D–E, Protein expression (represented as mean ± SEM) relative to loading control after immunoblotting analysis of NOXA, MCL1, and cleaved caspase-9 expression in protein lysates of five representative tumor samples from each treatment group of mice bearing SUM190PT or SUM149PT tumors. Tubulin expression was used as a protein loading control. Pixel density of protein bands was quantified for each condition using ImageJ software. *, P < 0.05; **, P < 0.001; ***, P < 0.0001.

