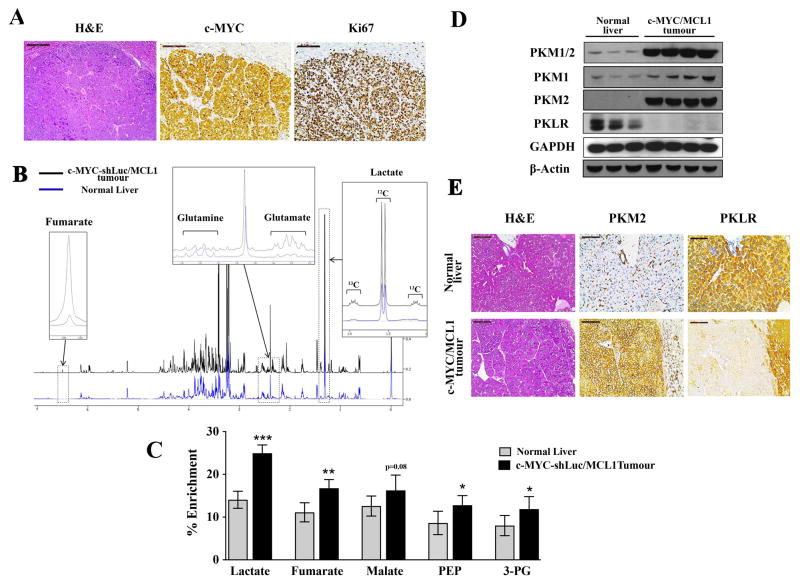
Figure 1. c-MYC-induced liver tumorigenesis is associated with increased glycolysis and a switch from PKL to PKM.
A) Immunohistochemical patterns of c-MYC and Ki67 in c-MYC/MCL1 tumors. Scale bars, 100μm. B)Representative 1H-NMR spectra from extracts of normal livers (blue) and c-MYC/MCL1 liver tumors (black) of mice injected with a bolus of 13C-Glucose. Regions of interest are magnified to show increased pools of glutamate, fumarate and lactate and decreased pool of glutamine in tumors in comparison with normal tissue. Increased 13C incorporation into lactate is denoted by the 13C satellites of the H3-lactate. C) % Enrichment from 13C6-glucose in glycolytic and Krebs cycle intermediates measured by GC-MS. Data are presented as mean ± SD. Student’s t-test was used; *p <0.05, **p <0.01, ***p <0.001. D)PKM1/2 and PKLR protein levels measured in whole-tissue lysates from normal and tumor samples by immunoblotting using β-Actin and GAPDH as a loading control. E) Expression of PKM2 and PKLR examined by immunochemistry in normal livers and c-MYC/MCL1 liver tumors. Scale bars, 100μm.

