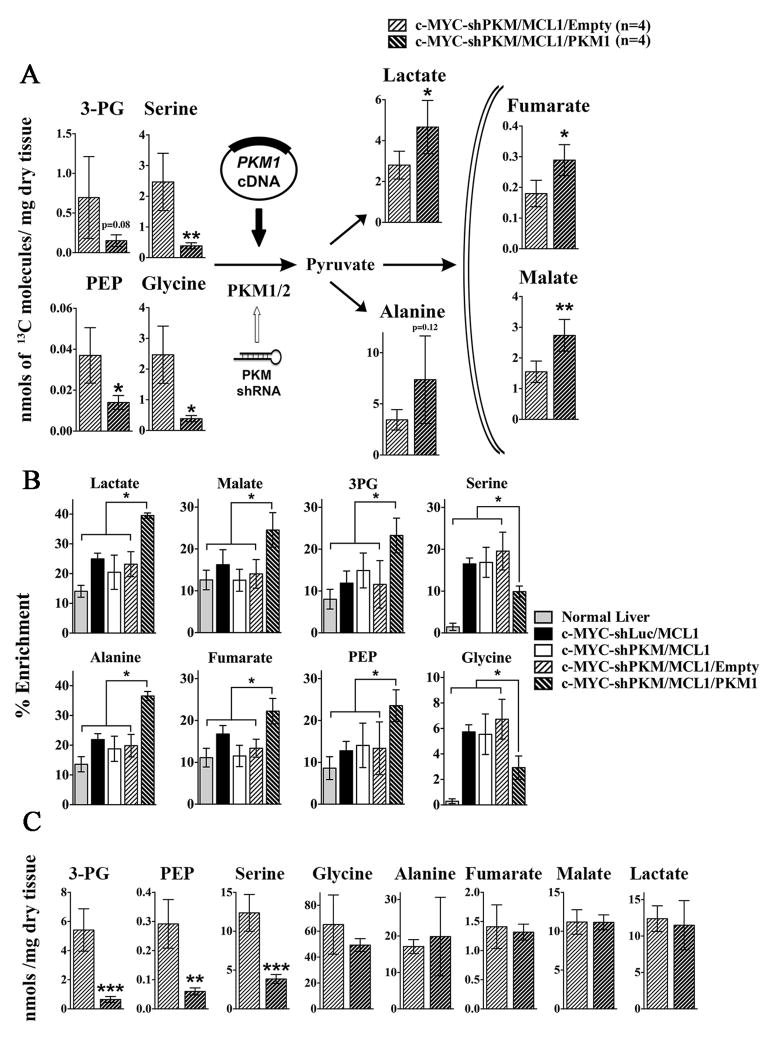
Figure 5. PKM1 overexpression increases PK flux in vivo.
Livers and tumors from mice injected with 13C-glucose boluses were analysed by GCMS. A) The levels of 13C-lableled metabolites (sum of all isotopomers except M+0) are presented. Data are presented as mean ± SD. *p <0.05; **p <0.01, unpaired two-sided Student’s t test. B) Total concentration of the metabolites shown in A. In A and B data are presented as mean ± SD. *p <0.05; **p <0.01, ***p <0.001, unpaired two-sided Student’s t test. C) 13C enrichment of metabolites is presented (experimental groups introduced in Figure 1 and 3 are included for comparison). Data are presented as mean ± SD; *p <0.05. One-way ANOVA, with a Turkeys post hoc test.

