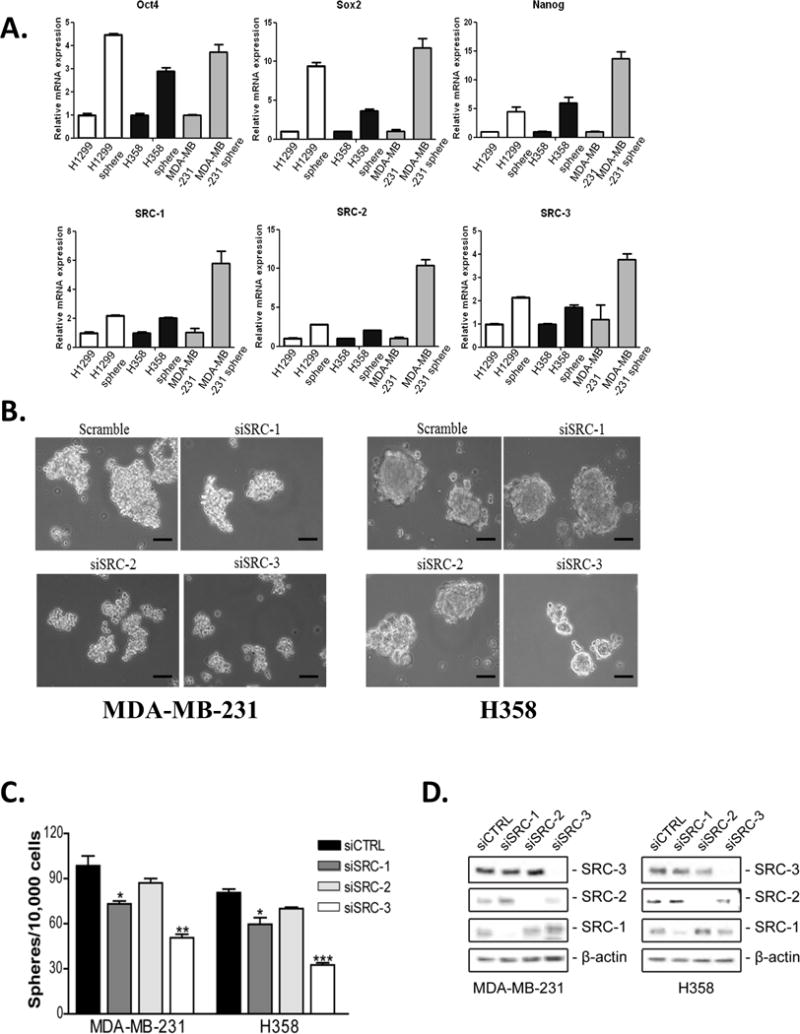
Figure 1. SRCs are important for tumorsphere formation.

Expression of SRC-1, -2 and -3 is increased in tumorspheres. (A) Total RNA was isolated from H1299, H358 and MDA-MB-231 cells grown either in monolayer culture or in serum free media on ultra-low attachment plates and converted to cDNA. QPCR was performed using primers for GAPDH, Oct4, Sox2, Nanog, SRC-1, -2 and -3. Gene expression was quantified using GAPDH as an internal control. Values shown are the mean ± S.E.M. (n=3). (B-D) Reduced expression of SRC-1 and -3 but not SRC-2 reduces tumorsphere formation. MDA-MB-231 and H358 cells were transfected with either control siRNA or siRNA targeting SRC-1, SRC-2 or SRC-3. (B) Bright field images of siRNA transfected cells plated in serum free media on ultra-low attachment plates after 8 days. Scale bar = 50 μm. (C) Tumorspheres greater than 50 μm were counted and the numbers of spheres formed were graphed. Values shown are the mean ± S.E.M. (n=3). One-way ANOVA followed by Tukey’s multiple comparison tests were used for significance testing. * = p < 0.05, ** = p < 0.01, *** = p < 0.001. (D) 48 hours post transfection total protein was isolated from the cells and subjected to immunoblot analysis with antibodies to SRC-1, SRC-2, SRC-3 and β-actin.
