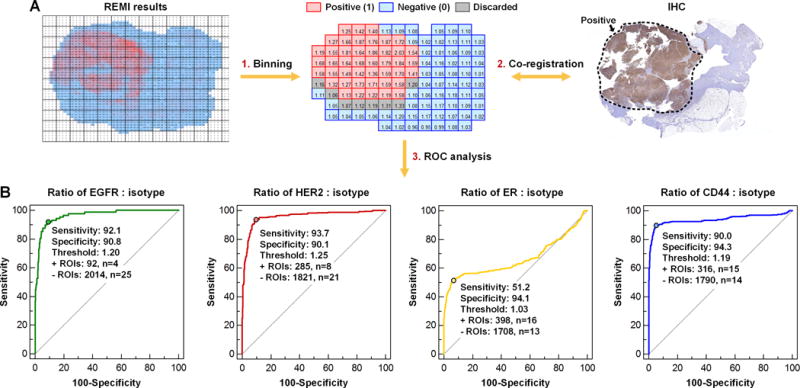
Figure 5. ROC analysis for the identification of biomarker overexpression by REMI.

A, Co-registration of IHC and REMI data. B, ROC curves for the biomarkers EGFR, HER2, ER and CD44. The ratio of targeted NPs vs. isotype-NPs from each of 2106 ROIs were used to generate the ROC curves, in which IHC was used as the gold standard for detection of overexpressed biomarkers. For the detection of EGFR overexpression, the area under the curve (AUC) = 0.96 with a 95% confidence interval (CI) of 0.96–0.97. For the detection of HER2 overexpression, the AUC = 0.96 with a 95% CI of 0.95–0.97. For the detection of mER overexpression, the AUC = 0.67 with a 95% CI of 0.64–0.69. For the detection of CD44 overexpression, the AUC = 0.94 with a 95% CI of 0.93–0.95.
