
Fig. 3. Effect of drug treatment on circulating levels of IL-6, CRP, IL-10 and cortisol levels (n=18 per group).
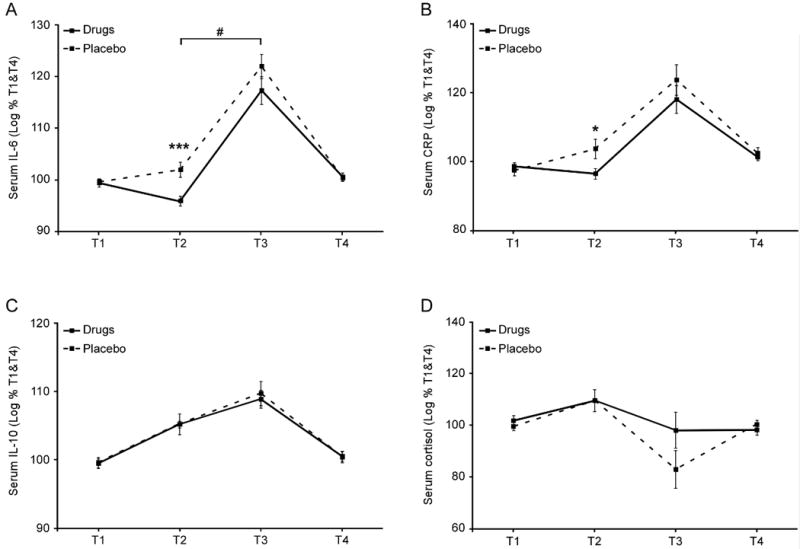
Serum levels of IL-6 (A), C-reactive protein (B), cortisol (C), and IL-10 (D) were assessed by commercial enzyme-linked immunosorbent assay (high-sensitivity ELISA kits for IL-6 and IL-10). Data represent mean ± SEM. Group differences at a specific time point are indicated by * (p<.05), *** (p<.001). A significant contrast between drug and placebo conditions during treatment (T2+T3) [vs off treatment (T1+T4)] is indicated by #.