
Fig. 4. Effect of drug treatment on ex vivo stimulated production of IL-12 and IFN-γ, on numbers of circulating CD16− monocytes, and on CD11a (LFA-1) expression levels on NK cells (n=18 per group).
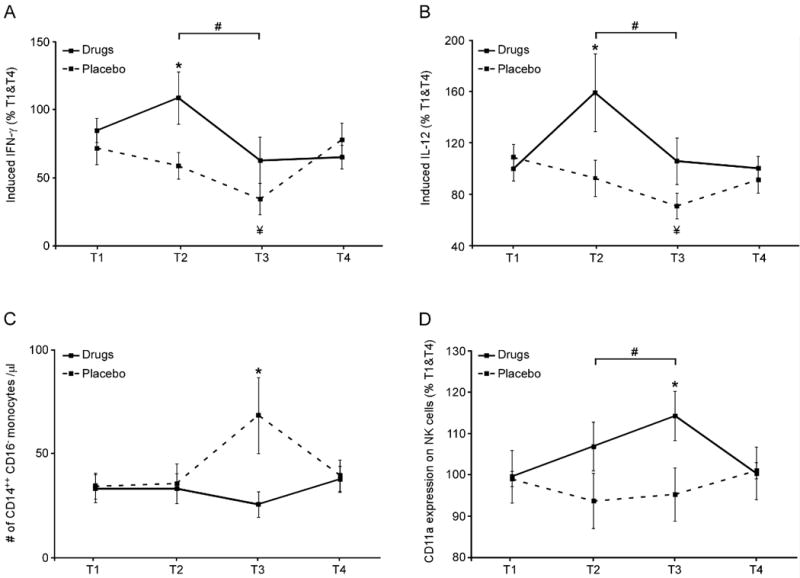
Venipuncture blood samples were assayed for: (A and B) Induced cytokine levels following 21-hrs LPS & PHA-stimulation, assessed in culture supernatant by enzyme-linked immunosorbent assay (ELISA); (C) circulating frequency of CD14++CD16− “classical” monocytes, and (D) expression levels of the activation marker CD11a on NK cells (CD3−CD56+CD16+ lymphocytes), assessed by flow cytometry. Data represent mean ± SEM. Group differences at a specific time point are indicated by * (p < 0.05). A significant contrast between drug and placebo treatments at T2+T3 [vs off treatment (T1+T4)] is indicated by #. A significant decrease from T1 to T3 within the placebo group is indicated by ¥.