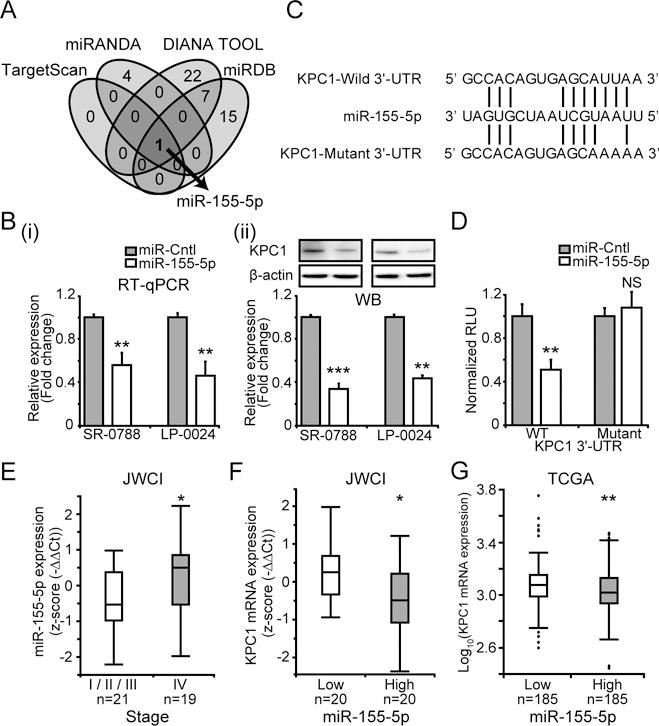
Figure 2. Epigenetic regulatory mechanism of KPC1 expression.

(A) Venn diagram showing putative miRs that target 3′-UTR of KPC1 mRNA predicted by different computational tools (TargetScan, miRANDA, DIANA TOOL, and miRDB). (B) SR-0788 and LP-0024 were transfected with pre-miR-155-5p (miR-155-5p) or miR control (miR-Cntl). KPC1 expression was quantified using (i) RT-qPCR (ii) WB after miR-155-5p transfection (t-test, ** p<0.01, *** p<0.001). (C) miR-155-5p sequence aligned with human KPC1-Wild 3′-UTR (WT) and KPC1-Mutant 3′-UTR (Mutant) sequences. (D) A luciferase reporter activity assay to determine miR-155-5p targets 3′-UTR of KPC1 using human KPC1-Wild 3′-UTR (WT) and KPC1-Mutant 3′-UTR (Mutant) sequences on RenSP vector (t-test, NS p≥0.05, ** p<0.01). (E) Boxplot of miR-155-5p expression in JWCI cohort assessed by RT-qPCR (n=40, Wilcoxon-test, * p<0.05). (F) Boxplot of KPC1 expression in the patients with miR-155-5p low (n=20) or high (n=20) expression (classified based on median of miR-155-5p expression) from JWCI cohort (n=40, Wilcoxon-test, * p<0.05). (G) Boxplot showing KPC1 expression in patients with miR-155-5p low (n=185) and high (n=185) expression (classified based on median of miR-155-5p expression) from TCGA cohort (t-test, ** p<0.01). Error bars represent means ± SD from replicates (n=3). WB images were cropped for clarity and focus on relevant bands.
