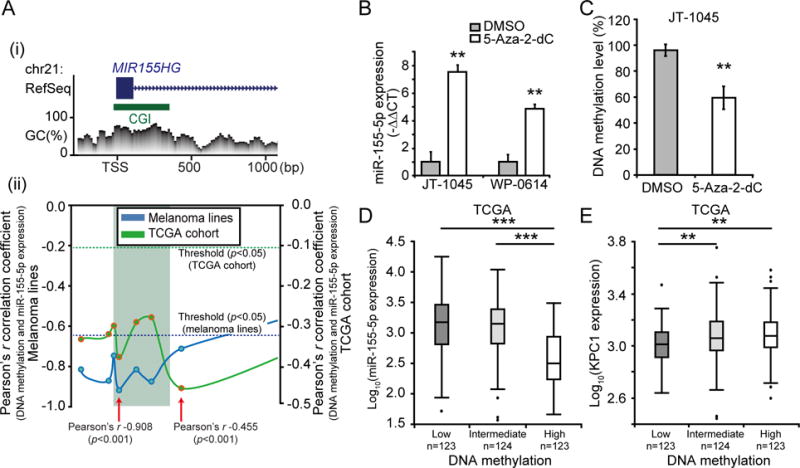
Figure 3. Regulatory mechanism of miR-155-5p expression in melanoma.

(A) Promoter DNA methylation level of MIR155HG gene were analyzed to investigate the regulatory mechanism of miR-155-5p expression. (i) MIR155HG gene structure [based on RefSeq Feb. 2009 (GRCh37/hg19) assembly] and CpG Context at promoter region. Blue box represents exon and green box CGI (CpG island). (ii) Correlation analysis between DNA methylation and miR-155-5p expression levels from ten melanoma lines and TCGA cohort (n=370). The correlations were calculated using the Pearson’s r correlation coefficient for each CpG sites. Each point represents one CpG site and solid lines indicate the variation of correlation at the promoter region of MIR155HG gene. Dotted lines indicate the statistical significant threshold (p=0.05) for correlation analysis. CpG sites which demonstrated the strongest negative correlation are indicated by red arrows with its Pearson’s r in the figure. (B) JT-1045 and WP-0614 were treated with medium supplemented with 5-Aza-2-dC or control (DMSO), and miR-155-5p expression was quantified using RT-qPCR (t-test, ** p<0.01). (C) Boxplot showing DNA methylation level of miR-155-5p promoter region quantified by MSP from JT-1045 treated with 5-Aza-2-dC or control (DMSO) (t-test, ** p<0.01). (D & E) Association between miR-155-5p promoter DNA methylation level (Chr21:26,934,456, cg23433889) and miR-155-5p or KPC1 expression were analyzed for TCGA cohort (n=370). Boxplot showing (D) miR-155-5p expression or (E) KPC1 expression in patients with low (n=123), intermediate (n=124) and high (n=123) DNA methylation level (classified based on tertile of DNA methylation level) (t-test, ** p<0.01, *** p<0.001). Error bars represent means ± SD from replicates (n=3).
