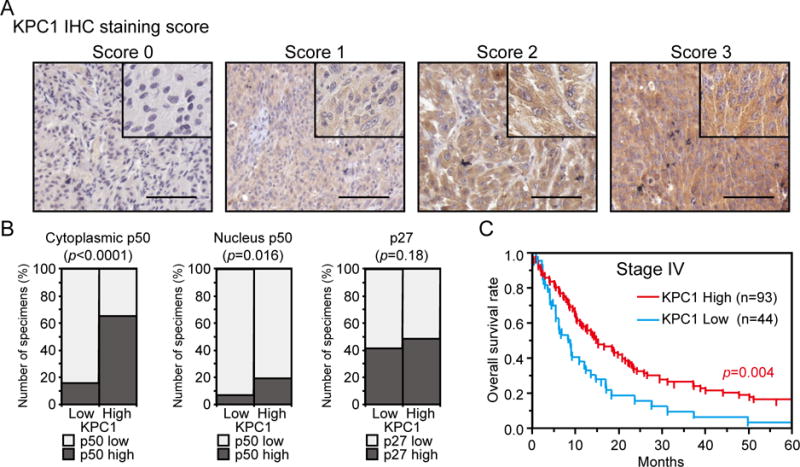
Figure 4. KPC1, p50 and p27 expression in melanoma patients’ tissues.

KPC1, NF-κB1 p50, and p27 expression were analyzed in melanoma patients’ tissues. (A) Representative images of AJCC stage IV melanoma TMA samples immunostained using anti-KPC1 Ab are shown. Staining intensity was evaluated from 0 (negative) to 3 (strong). The magnifications of the low-power and high-power images are ×100 and ×200, respectively. Scale bar = 100 μm. (B) Association between KPC1 expression and cytoplasmic p50, nucleus p50 or p27 expression in stage IV melanoma TMA samples (n=262). (C) Kaplan-Meier curves showing OS for KPC1 high (Score 2 and 3) or low (Score 0, 1) expression patients from stage IV melanoma TMA (n=137). Significance of log rank is shown.
