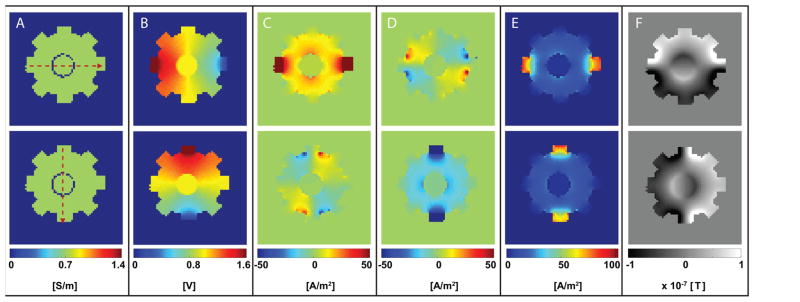
Figure 3.
Simulated phantom data produced using finite element model. Images corresponding to horizontal (I1) and vertical (I2) current injections are shown in top and bottom rows, respectively. From left to right, distributions of conductivity (A: σ), voltage (B: V), true current density (C: , D: , E: ), and magnetic flux density (F: ) in a central slice with a 10 mA current injection are shown.

