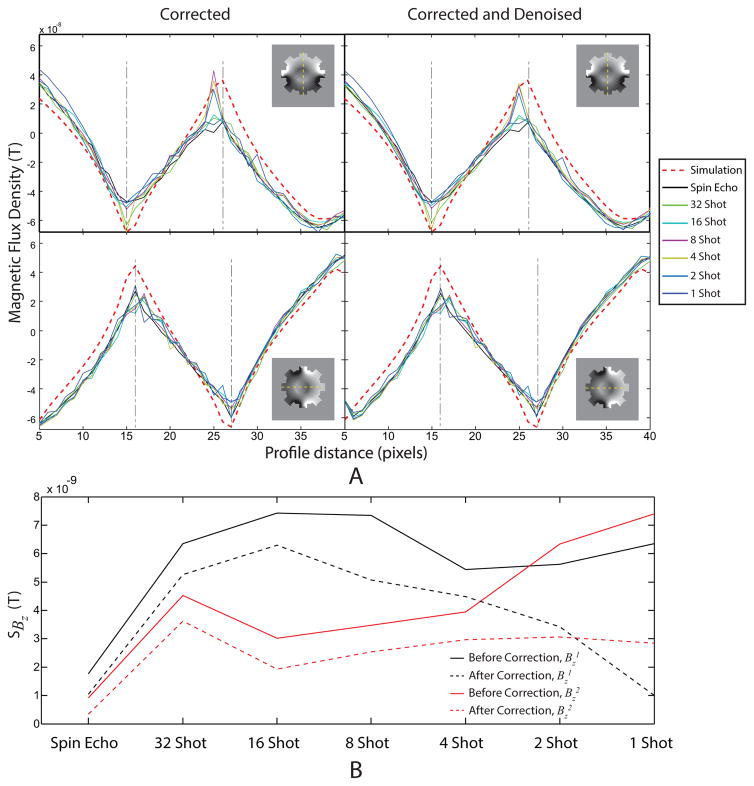
Figure 6.
(A) Profiles of experimental Bz data in a slice through the center of the phantom before and after denoising and in-painting (‘denoising’). Data are shown before (left) and after (right) denoising for both horizontal (top) and vertical (bottom) 10 mA current injection. (B) Standard deviations in MREIT data calculated using [10] for (black) and (red) data both before (solid lines) and after (dashed lines) correction and denoising.

