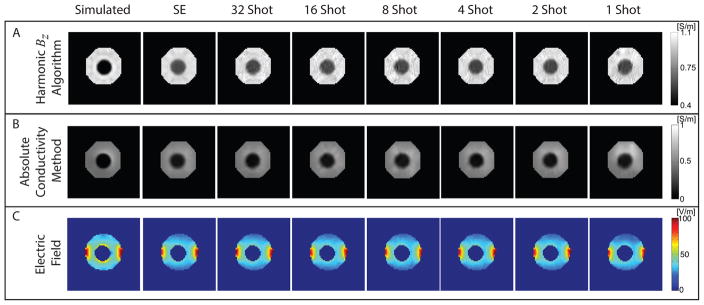
Figure 8.
Conductivity and electric field distributions reconstructed from corrected and denoised Bz data. (A) Conductivity images reconstructed using the harmonic Bz algorithm, (B) conductivity images reconstructed using the absolute conductivity method, and (C) Projected electric field images calculated for horizontal current injections as a function of shot number. Electric field values inside the anomaly have been masked out.

