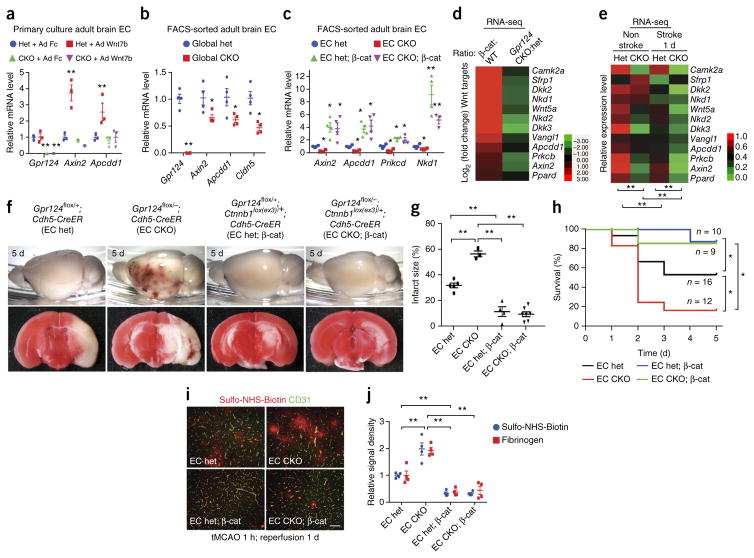
Figure 2.
Activation of endothelial Wnt–β-catenin signaling rescues the hemorrhagic-stroke phenotype of Gpr124-deficient mice. (a) Expression of Gpr124 and the Wnt target genes Axin2 and Apcdd1, as assessed by RT–qPCR, in primary brain ECs from adult global Gpr124-CKO and het mice; cells were infected with adenovirus expressing mouse IgG2α Fc (Ad Fc) or Wnt7b (Ad Wnt7b) for 2 d before determination of mRNA levels. Data are mean ± s.e.m. of triplicate experiments. **P < 0.01, unpaired Student’s t-test. (b) Expression of Gpr124, Wnt target genes and the BBB marker Cldn5, as assessed by RT–qPCR, in freshly isolated brain ECs of tamoxifen-treated global Gpr124-CKO mice versus het mice. Mean ± s.e.m., n = 4 mice per group. Individual mice are plotted. *P < 0.05, **P < 0.01, unpaired Student’s t-test. (c) Expression of Wnt-signaling target genes, as assessed by RT–qPCR, in FACS-sorted adult brain ECs from EC Gpr124-CKO versus het mice with or without constitutive β-catenin activation (β-cat). Mean ± s.e.m., n = 4 mice per group. Individual mice are plotted. This experiment was repeated with n = 4 mice per group. *P < 0.05, **P < 0.01 versus het, unpaired Student’s t-test. (d) Fold changes (log2) in expression of canonical Wnt-signaling target genes, as assessed by RNA-seq analysis, in FACS-sorted brain ECs from tamoxifen-treated mice, showing comparisons between Ctnnb1lox(ex3)/+;Cdh5-CreER (β-cat) mice versus Ctnnb1+/+;Cdh5-CreER (WT) mice (n = 3 mice per group), and global Gpr124-CKO mice versus het mice (n = 4 mice per group). (e) Relative expression levels of Wnt target genes, as assessed by RNA-seq analysis, of brain ECs from the stroke and nonstroke hemispheres of adult global Gpr124-CKO and het mice after 1 h tMCAO and 1 d reperfusion. For each gene, the level of gene expression is presented relative to the het nonstroke value and assigned to values between 0 and 1 to allow red–green color depiction. n = 4 mice per group. **P < 0.01, paired Student’s t-test. (f) Gross appearance (top) and TTC staining (bottom) of brains of EC Gpr124-CKO versus het mice with or without endothelial constitutive β-catenin activation to show intracerebral hemorrhage and infarcted areas (white in TTC staining) after 1 h tMCAO and 5 d reperfusion. (g) Quantification of infarct size determined by TTC staining. EC het, n = 5 mice; EC CKO, n = 3; EC het; β-cat, n = 4; EC CKO; β-cat, n = 7. **P < 0.01, unpaired Student’s t-test. (h) Survival of EC Gpr124-CKO versus het mice with or without endothelial constitutive β-catenin activation after 1 h tMCAO and 5 d reperfusion. *P < 0.05, log–rank test. (i) Representative images of BBB integrity in brains of the indicated mice after 1 h tMCAO and 1 d reperfusion, as assessed by the Sulfo-NHS-biotin tracer extravasation assay. Scale bar, 50 μm. (j) Quantification of extravasated exogenous tracer Sulfo-NHS-biotin or endogenous plasma fibrinogen. Biotin or fibrinogen signal density was measured with ImageJ and normalized to vessel area (CD31). Data are mean ± s.e.m., n = 4 mice per group. **P < 0.01, unpaired Student’s t-test.

