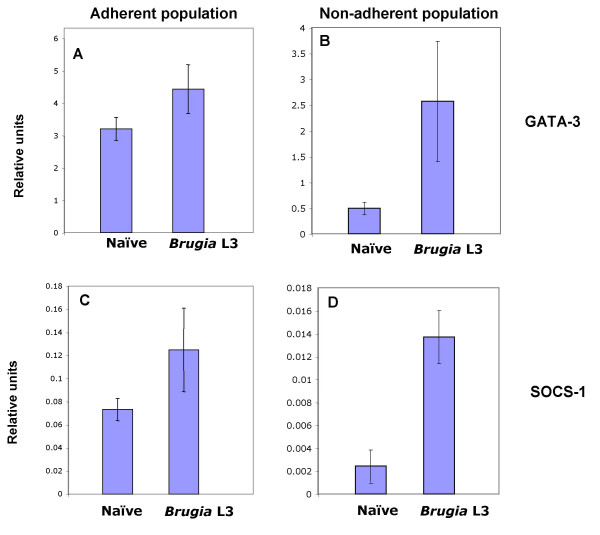
Figure 6.

Up-regulation of GATA-3 and SOCS-1 in filarial infection Peritoneal cells were recovered 7 days after ip infection with 200 L3s. (A, C) Adherent (macrophage-enriched) and (B, D) non-adherent (predominantly lymphocytes) populations were separated and cDNA synthesised from total RNA. The abundance of GATA-3 (A, B) and SOCS-1 (C, D) was determined as in Figure 5. Each bar represents mean ± standard error of the mean. (One way analysis of variance; p = 0.05). Data are representative of two experiments.
