Fig. 1.

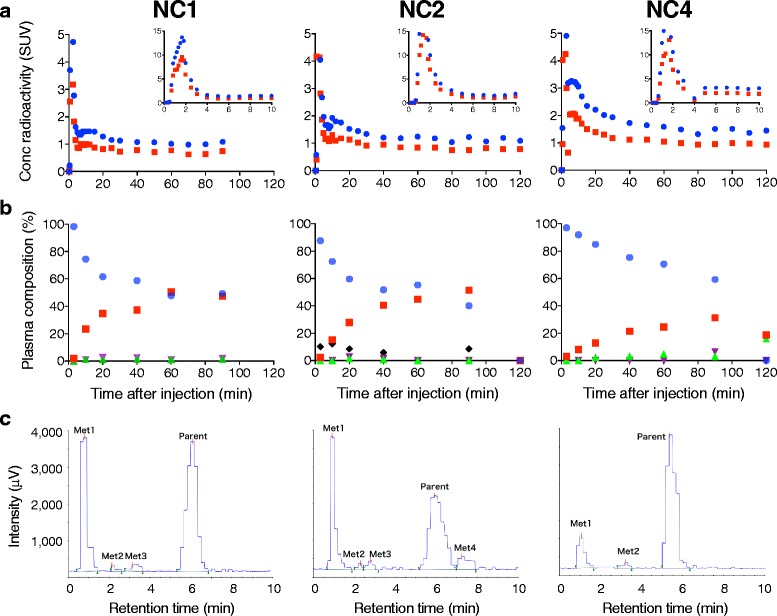
Concentration of radioactivity and composition of plasma radioactivity in arterial plasma after injection of [11C]HMS011 in three subjects (NC1, NC2, and NC4). a Concentration of radioactivity in plasma (blue) and whole blood (red). Values from 0 to 10 min and 10 to 120 min are shown in the two graphs with different y-axis ranges. b Composition of parent and radiometabolites in plasma. Parent (blue) and radiometabolites (metabolite 1: red, metabolite 2: green, metabolite 3: purple, and metabolite 4: black) are plotted against time after injection. Note that metabolite 4 was detected only in NC2. c Radiochromatogram of plasma at 20 min (NC1 and NC2) and 60 min (NC4) after injection of [11C]HMS011. Two or three hydrophilic radiometabolites (metabolites 1–3) were detected in all subjects. A lipophilic radiometabolite (Met4) was detected only in NC2
