Fig. 5.

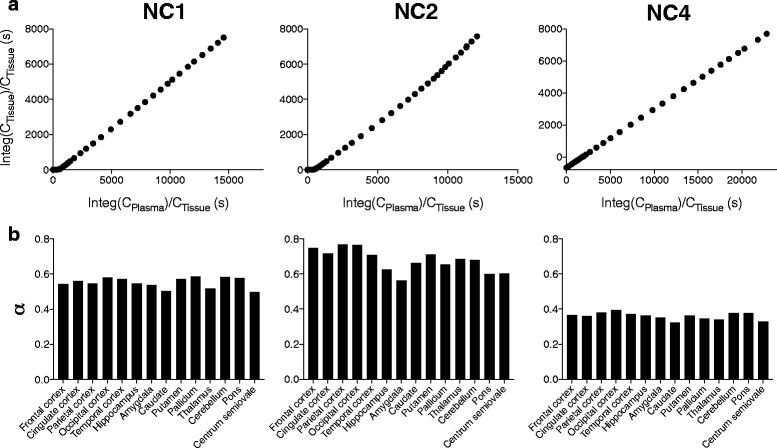
a Dual-input graphical plots in the frontal cortex in three subjects. b Regional distribution volumes (α) determined by the dual-input graphical model in three subjects

a Dual-input graphical plots in the frontal cortex in three subjects. b Regional distribution volumes (α) determined by the dual-input graphical model in three subjects