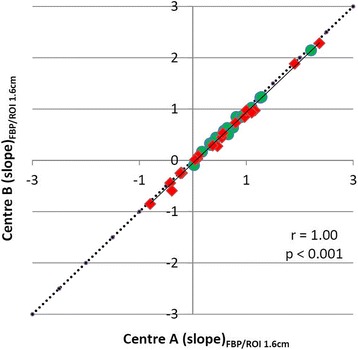
Fig. 7.

Correlation of slope of the TAC of 18F-FET uptake from 10 to 40 min p.i., comparing the effect of different framing in centres A and B. All data were reconstructed by FBP according to centre A and evaluated with a circular ROI with fixed a diameter of 1.6 cm. There is a highly significant correlation which virtually excludes an influence of different data framing. High-grade tumours are indicated by red symbols and low-grade tumour by green symbols
