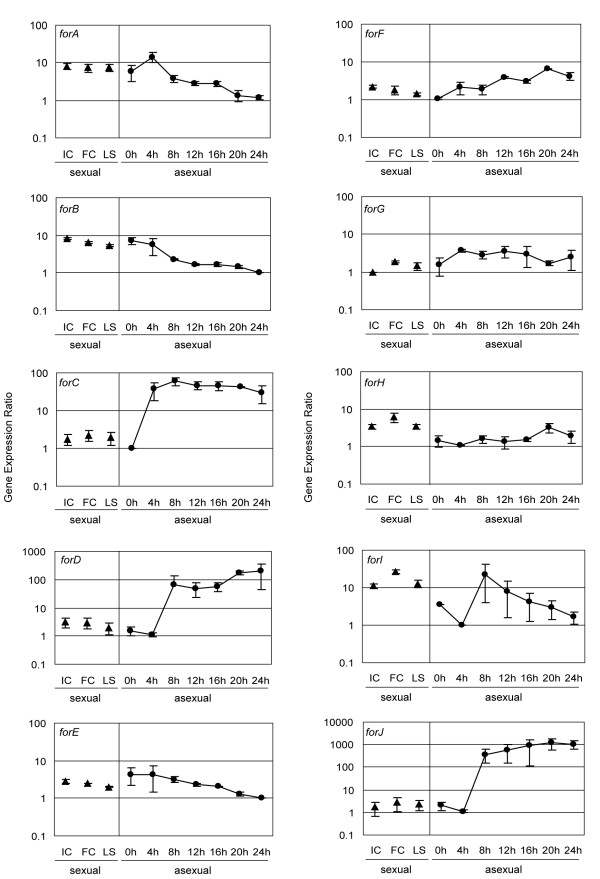
Figure 6.
Expression analysis of Dictyostelium formin genes. Expression analysis was performed using quantitative real time PCR on two independently isolated mRNA samples both in sexual and asexual developmental stages. Average and standard deviation of two independent expression ratios obtained from independent cDNA samples are shown. IC, fusion incompetent cells; FC, fusion competent cells; LS, light submerged cells.

