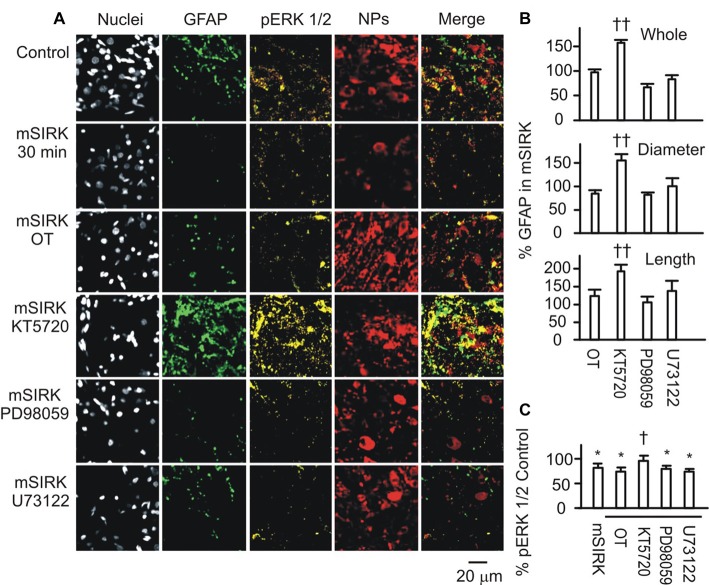
Figure 4.
Roles of OTR-associated signals in Gβγ subunit-modulated expressions of GFAP and phosphorylated extracellular signal-regulated protein kinase (pERK) 1/2. (A) Confocal images (left to right) show staining for nuclei, GFAP, pERK 1/2, NPs and their merges. From top to the bottom, images were acquired in control, mSIRK (0.5 μM, 30 min) and mSIRK following 30 min pretreatment with OT, KT5720 (10 μM), PD98059 (20 μM), or U73122 (10 μM), respectively. (B) Summary graphs of GFAP expression in whole field view, the diameter, or length of GFAP filaments relative to mSIRK alone. (C) Summary graphs of pERK 1/2 under different conditions. Note that, *P < 0.05 compared to the control; †P < 0.05 and ††P < 0.01 compared with mSIRK alone. Other annotations refer to Figures 1, 3.

