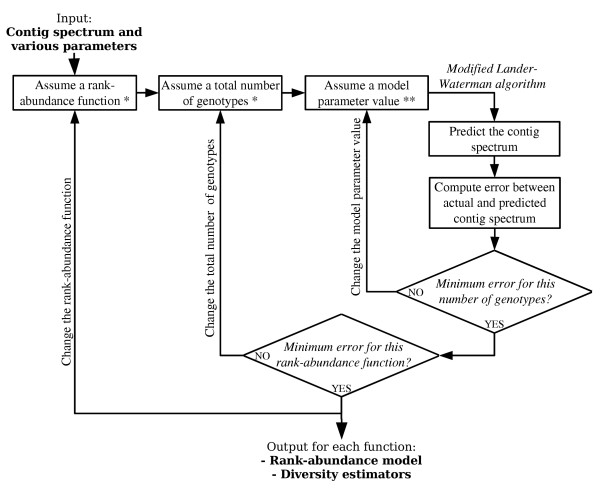
Figure 1.

Flowchart of PHACCS. *The rank-abundance functions and the range of genotypes to use can be defined by the user. **This parameter represents b for the power law, logarithmic, lognormal and exponential distributions and k for the niche preemption. This parameter is not applicable to the broken stick.
