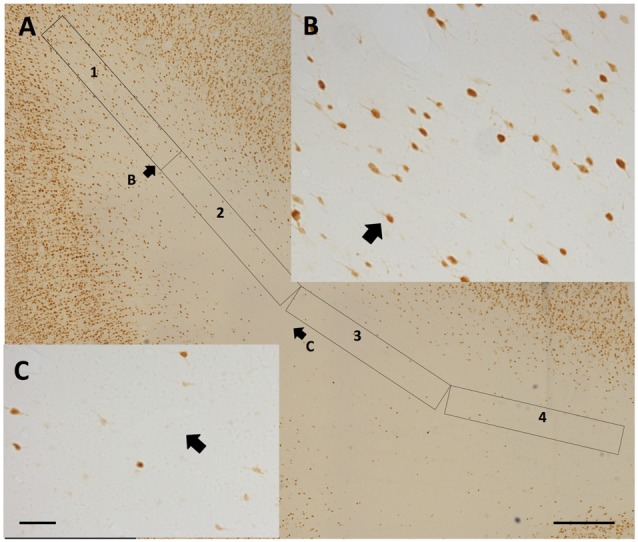
Figure 6.

(A) Representative 4-zone (1.125 mm long) rectangular counting frame, for determining WMN density as a function of distance from the gyral crown (at upper left). Zones 3 and 4 are tilted slightly, in order to remain near the middle of the gyrus. (B) Higher magnification from the distal portion of zone 1. (C) Higher magnification from the proximal portion of zone 3. Short arrows in (A,B) and (A,C) indicate corresponding fields. Scale bars = 500 μm in (A); 50 μm in (B,C).
