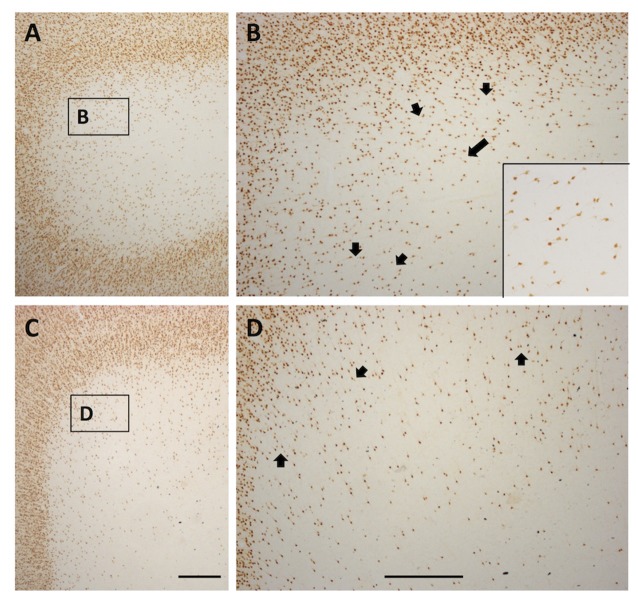
Figure 8.
Photomicrographs from a TE (A and higher magnification B) and SFG gyral region (C and higher magnification D). Both show a quasi-circular pattern, with scattered WMNs around the perimeter of cell-free gaps. Short arrows in (B,D) indicate several of the circular, cell-free gaps. Long arrow in (B) points to the boxed region shown at higher magnification in the inset at lower right. Boxes in (A,C) correspond to higher magnification views in (B,D). In (A), lateral is to the left, and in (C), medial is to the left. Scale bars = 500 μm.

